Master the Markets with the Ichimoku Kinko Hyo Indicator
In the world of technical analysis, few tools offer as much comprehensive data at a single glance as the Ichimoku Kinko Hyo. Often referred to simply as "Ichimoku," this Japanese indicator translates to "one-look equilibrium chart." It is designed to provide traders with everything they need to know about a market's health—trend direction, momentum, and Support And Resistance levels—without needing to switch between multiple indicators.
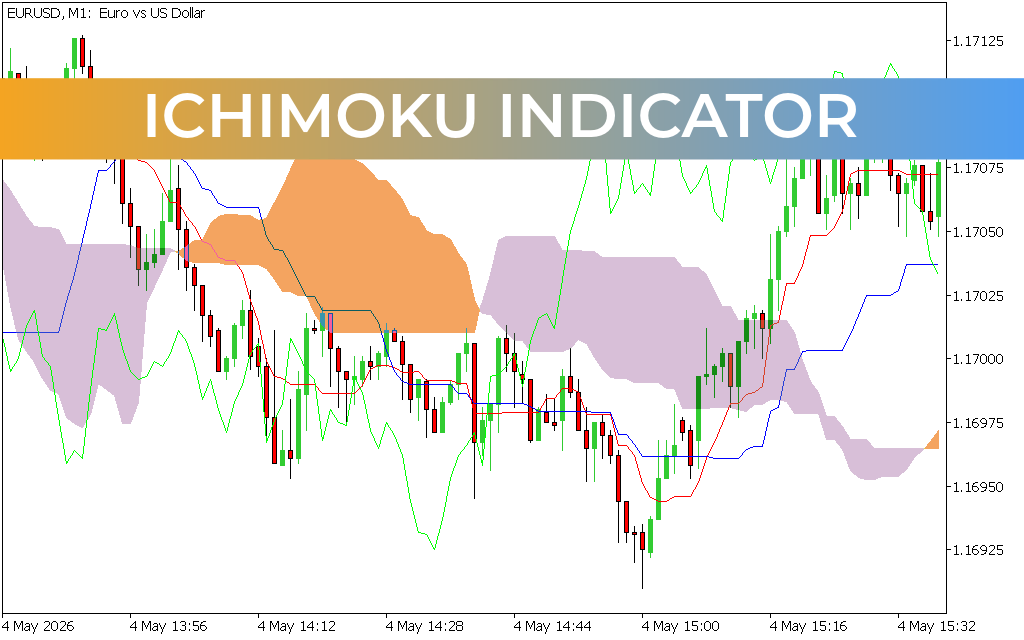
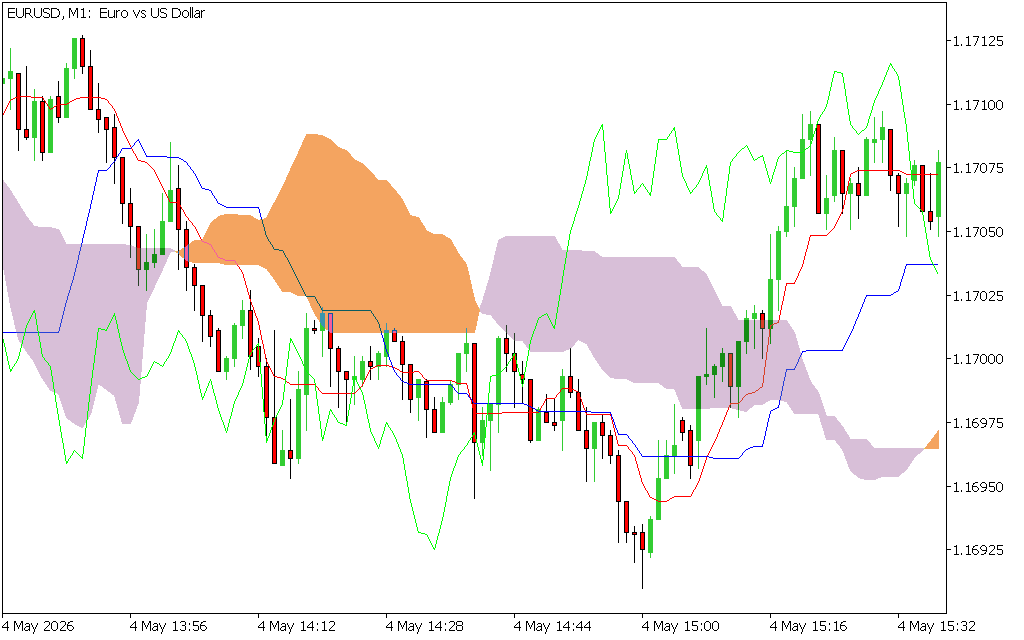
As seen in the technical chart EURUSDM1.png, the Ichimoku indicator transforms a standard price chart into a rich landscape of data points. While it may look complex initially, its ability to filter out market noise makes it a favorite for both professional forex traders and retail investors.
The Five Pillars of Ichimoku
To trade effectively with Ichimoku, you must understand its five core components:
- Tenkan-sen (Conversion Line): Represented by the fast-moving red line in EURUSDM1.png, it calculates the average of the highest high and lowest low over the past 9 periods. It signals short-term momentum.
- Kijun-sen (Base Line): The blue line in EURUSDM1.png, this tracks the mid-point of the last 26 periods. It acts as a major indicator of future price movement and a reliable support/resistance level.
- Senkou Span A & B (The Kumo Cloud): These two lines create the shaded "Cloud" (Kumo) seen in EURUSDM1.png. The cloud is the heart of the system; when price is above it, the trend is bullish; when below, it is bearish.
- Chikou Span (Lagging Span): This green line plots the current closing price 26 periods back, allowing traders to visualize the current Price Action against historical trends.
Why Traders Prefer Ichimoku
The primary advantage of Ichimoku is its predictive nature. Unlike many lagging indicators that only tell you what has happened, the Kumo Cloud is projected 26 periods into the future. This allows traders to anticipate where support and resistance zones will form well before the price arrives there.
Furthermore, the thickness of the cloud in EURUSDM1.png provides a visual representation of volatility. A thick cloud suggests strong support or resistance that is difficult to break, whereas a thin cloud indicates a potential "breakout" opportunity.
Strategy: The Kumo Breakout
One of the most popular strategies involves the Kumo Breakout. When price closes above the cloud while the Tenkan-sen crosses above the Kijun-sen, it signals a high-probability buy entry. Conversely, a price drop below the cloud suggests a strong sell signal.
By integrating the Ichimoku indicator into your strategy, you gain a holistic view of the market that traditional moving averages simply cannot provide.
1 Download
Last Update:
May 05, 2026 15:16 PM
Published:
Jan 27, 2026 20:45 PM
Category: