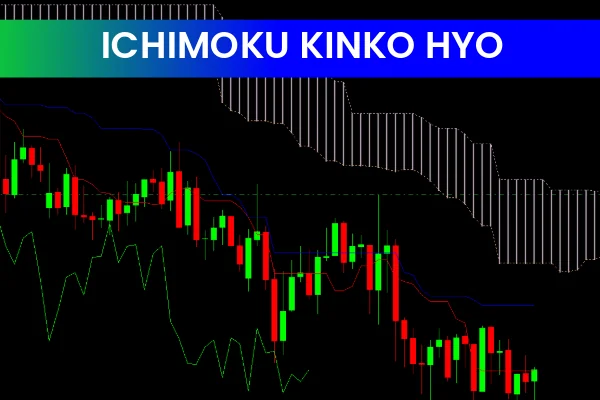
The Ichimoku Kinko Hyo indicator, also known simply as Ichimoku, is a highly popular and powerful forex tool for identifying market trends, momentum, and key support/resistance levels. It can be used as a stand-alone trading system or in combination with other technical indicators to enhance trading decisions.
Available for MetaTrader 4 (MT4), the Ichimoku indicator is free and provides traders with a comprehensive view of the market at a glance.
Components of the Ichimoku Indicator
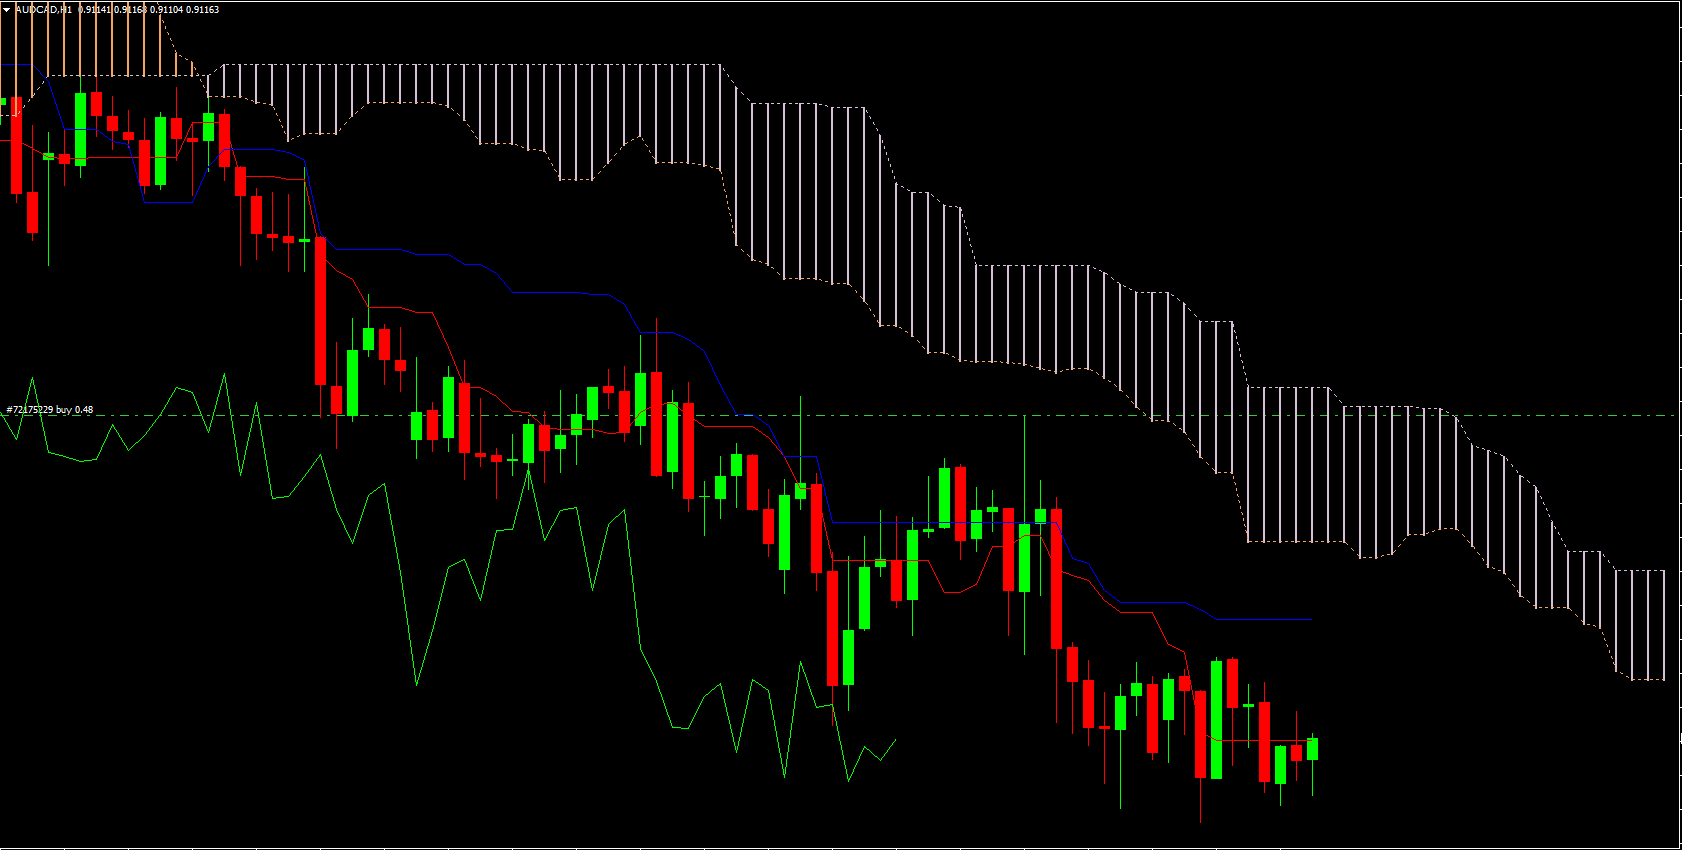
The Ichimoku system consists of five key lines:
Tenkan-sen (Conversion Line): A short-term moving average that reflects minor market trends.
Kijun-sen (Base Line): A medium-term moving average used to confirm the trend direction.
Senkou Span A (Leading Span A): Forms one edge of the “cloud” and represents a support/resistance level.
Senkou Span B (Leading Span B): Forms the other edge of the cloud and is another key support/resistance level.
Chikou Span (Lagging Span): Plots the current price shifted 26 periods back, helping identify potential entry and exit points.
How the Ichimoku Indicator Works
Trend Identification: When the Tenkan-sen is above the Kijun-sen, it indicates an uptrend. Conversely, when the Tenkan-sen is below the Kijun-sen, it signals a downtrend.
Support And Resistance: The Senkou Span A and B lines form the “cloud” (Kumo), which acts as dynamic support and resistance zones.
Entry and Exit Points: The Chikou Span provides insight into potential buy/sell opportunities by comparing the current price to past price levels.
Momentum Analysis: The distance between the lines and the cloud width can indicate the strength of the trend.
Benefits of Using Ichimoku Kinko Hyo
Comprehensive Market View: Combines trend, momentum, and support/resistance analysis in one indicator.
Versatile Trading Tool: Can be used for Scalping, day trading, or swing trading.
Easy Visualization: The cloud and lines help traders quickly understand market conditions.
Entry/Exit Assistance: Provides clear signals for potential trade entries and exits.
How to Use Ichimoku for Trading
Trend Confirmation: Trade in the direction of the Tenkan-sen/Kijun-sen crossover relative to the cloud.
Breakouts: Look for price breaking above or below the cloud for potential Trend Continuation.
Support/Resistance: Use the cloud edges as areas to place stop-loss or take-profit levels.
Momentum Strength: Wider cloud formations indicate stronger trends, while thinner clouds suggest weaker trends.
Final Thoughts
The Ichimoku Kinko Hyo MT4 Indicator is a robust all-in-one tool for forex traders looking to analyze trends, momentum, and Market Structure. Its combination of lines and the dynamic cloud makes it suitable for both beginners and advanced traders, helping to improve trade timing, risk management, and decision-making.
FAQ
Ichimoku Kinko Hyo is a comprehensive trend-following indicator that provides trend direction, support/resistance levels, momentum signals, and future price projections through its cloud (Kumo) system.
Tenkan-sen and Kijun-sen lines show short-term and medium-term trends, Senkou Span A and B form the cloud showing support/resistance, and Chikou Span confirms trend strength. Price position relative to cloud indicates trend.
Price above cloud indicates bullish trend, below cloud suggests bearish trend. Tenkan crossing above Kijun provides buy signals, crossing below gives sell signals. Cloud color changes indicate trend shifts.
Use for trend-following when price is in cloud direction, swing trading using cloud as support/resistance, momentum trading on Tenkan/Kijun crossovers, and comprehensive trend analysis.
Ichimoku provides complete trend analysis in one indicator, shows future support/resistance through cloud, offers multiple confirmation signals, and is highly effective for trend-following strategies.
Published:
Dec 17, 2025 02:15 AM
Category: