The Ichimoku Kinko Hyo System Indicator for MT4 is a complete trading system that generates Buy and Sell signals, evaluates trend strength, and displays the nearest Support And Resistance levels based on the classic Ichimoku components. With its on-chart information panel and signal alerts, it helps traders understand the market condition at a glance.
The indicator works well for both new and advanced forex traders. Beginners benefit from the organized interface and ready-made signals, while experienced traders can combine the signals with other tools for increased accuracy. It also performs well across all intraday timeframes, as well as the daily, weekly, and monthly charts.
Ichimoku Kinko Hyo System Indicator for MT4 Trading Signals
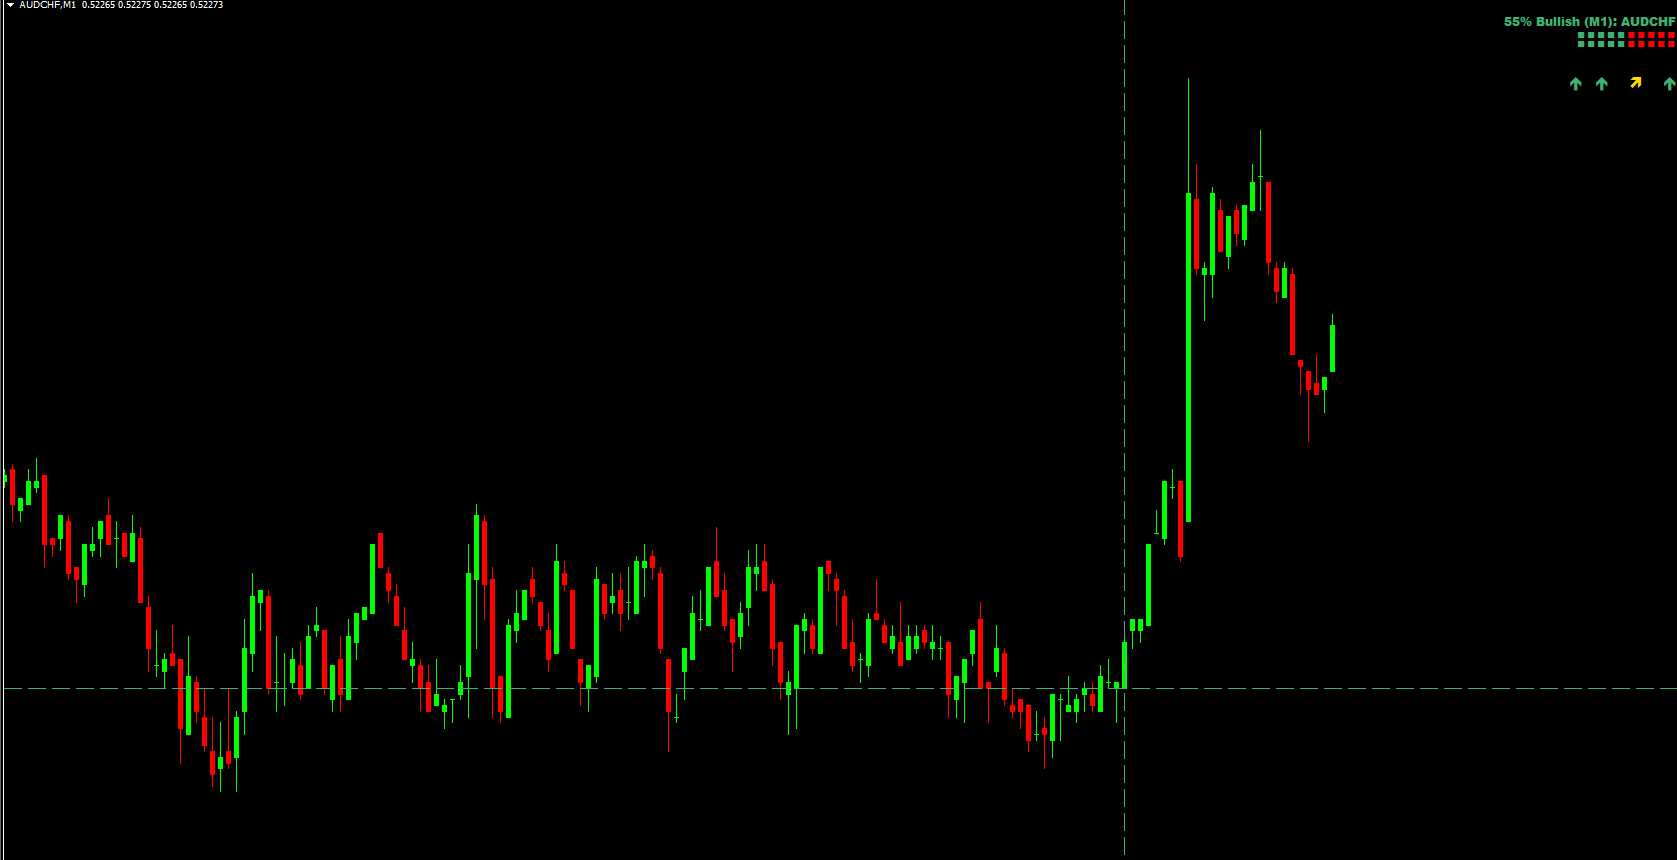
The GBPUSD H1 chart example shows how the Ichimoku Kinko Hyo system presents trend analysis and trading signals in the top-right corner.
The information panel displays bullish or bearish conditions of key Ichimoku elements:
PA – Price Action
P/KS – Price vs. Kijun-Sen
TS/KS – Tenkan-Sen vs. Kijun-Sen
CS – Chikou Span position
Each component helps determine overall market bias.
Signals are classified into Weak, Average, and Strong, making it easy for traders to gauge trend reliability. Alert notifications can be enabled within the indicator settings.
BUY Signal – How It Works
A Bullish signal triggers when multiple Ichimoku components turn bullish. The indicator marks the entry point with horizontal and vertical lines.
Suggested trade approach:
Enter a BUY at the signal line
Place stop loss below the previous swing low
Exit at:
An opposite signal, or
A favorable risk-to-reward target
Because the system follows trends, holding the trade until the next opposite signal often yields the best results.
SELL Signal – How It Works
A Bearish signal appears when the Ichimoku components collectively confirm downward momentum.
Suggested trade approach:
Enter a SELL at the indicated price
Set stop loss above the previous swing high
Exit when an opposite trading signal forms or when the desired risk-reward objective is achieved
As a trend-following system, the indicator performs best during strong directional movement.
When the Indicator Performs Best
Excellent in trending markets
Not ideal in ranging or sideways conditions, where Ichimoku signals naturally weaken
Works effectively across all timeframes, including higher-timeframe swing trading
Traders should avoid blindly taking signals during flat market conditions, as Ichimoku is inherently a trend-based methodology.
Conclusion
The Ichimoku Kinko Hyo System Indicator for MT4 is a complete trading solution that provides structured Buy/Sell signals, Trend Strength analysis, and support/resistance levels. While it excels in trending markets, traders should use caution during range-bound conditions. The indicator is free to download and easy to install, making it a valuable tool for traders of all experience levels.
FAQ
2 Downloads
Published:
Nov 19, 2025 22:20 PM
Category: