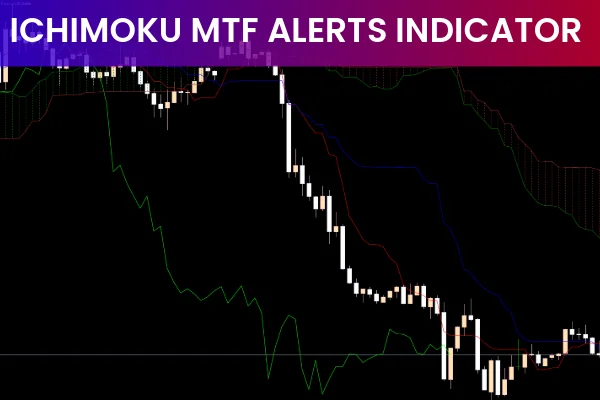
The Ichimoku MTF Alerts Indicator is an advanced trading tool that expands the functionality of the traditional Ichimoku indicator by displaying multi-timeframe data on a single chart. This allows traders to quickly assess market trends, support/resistance levels, and potential buy or sell signals without switching timeframes.
Originating from Japan, the Ichimoku system consists of five key elements: Tenkan Sen, Kijun Sen, Senkou Span A & B, Kumo, and Chikou Span. While mastering all these elements can be complex, the Ichimoku MTF Alerts Indicator simplifies their usage, allowing even beginners to use it effectively for forex trading.
How the Ichimoku MTF Alerts Indicator Works
Tenkan Sen (Fast Line)
Light green line representing the average of the highest high and lowest low over 9 periods.
Indicates short-term market direction (uptrend or downtrend).
Kijun Sen (Slow/Base Line)
Magenta line representing the average of the highest high and lowest low over 26 periods.
Acts as a support/resistance level and a trailing stop reference.
Chikou Span
Dark orange line showing the current closing price shifted back 26 periods.
Helps confirm trend direction and buy/sell signals.
Kumo (Cloud)
Shaded area between Senkou Span A and B, representing current and future support/resistance levels.
Price above the cloud indicates bullish momentum; price below the cloud indicates bearish momentum.
Trading Signals
Buy Signal
Tenkan Sen is trending upward.
Price is above Kijun Sen.
Chikou Span crosses the price from below.
Kumo cloud acts as support if the price is above it.
Sell Signal
Tenkan Sen is trending downward.
Price is below Kijun Sen.
Chikou Span crosses the price from above.
Kumo cloud acts as resistance if the price is below it.
By observing these conditions, traders can confidently enter long or short positions while using the Kumo cloud as an additional guide for Support And Resistance levels.
Benefits of Ichimoku MTF Alerts
Multi-timeframe analysis in a single chart view.
Clear buy and sell signals for forex trading.
Identifies support and resistance levels with the Kumo cloud.
Works as a standalone indicator for intraday and swing trading.
Improves accuracy by confirming trend direction with Chikou Span.
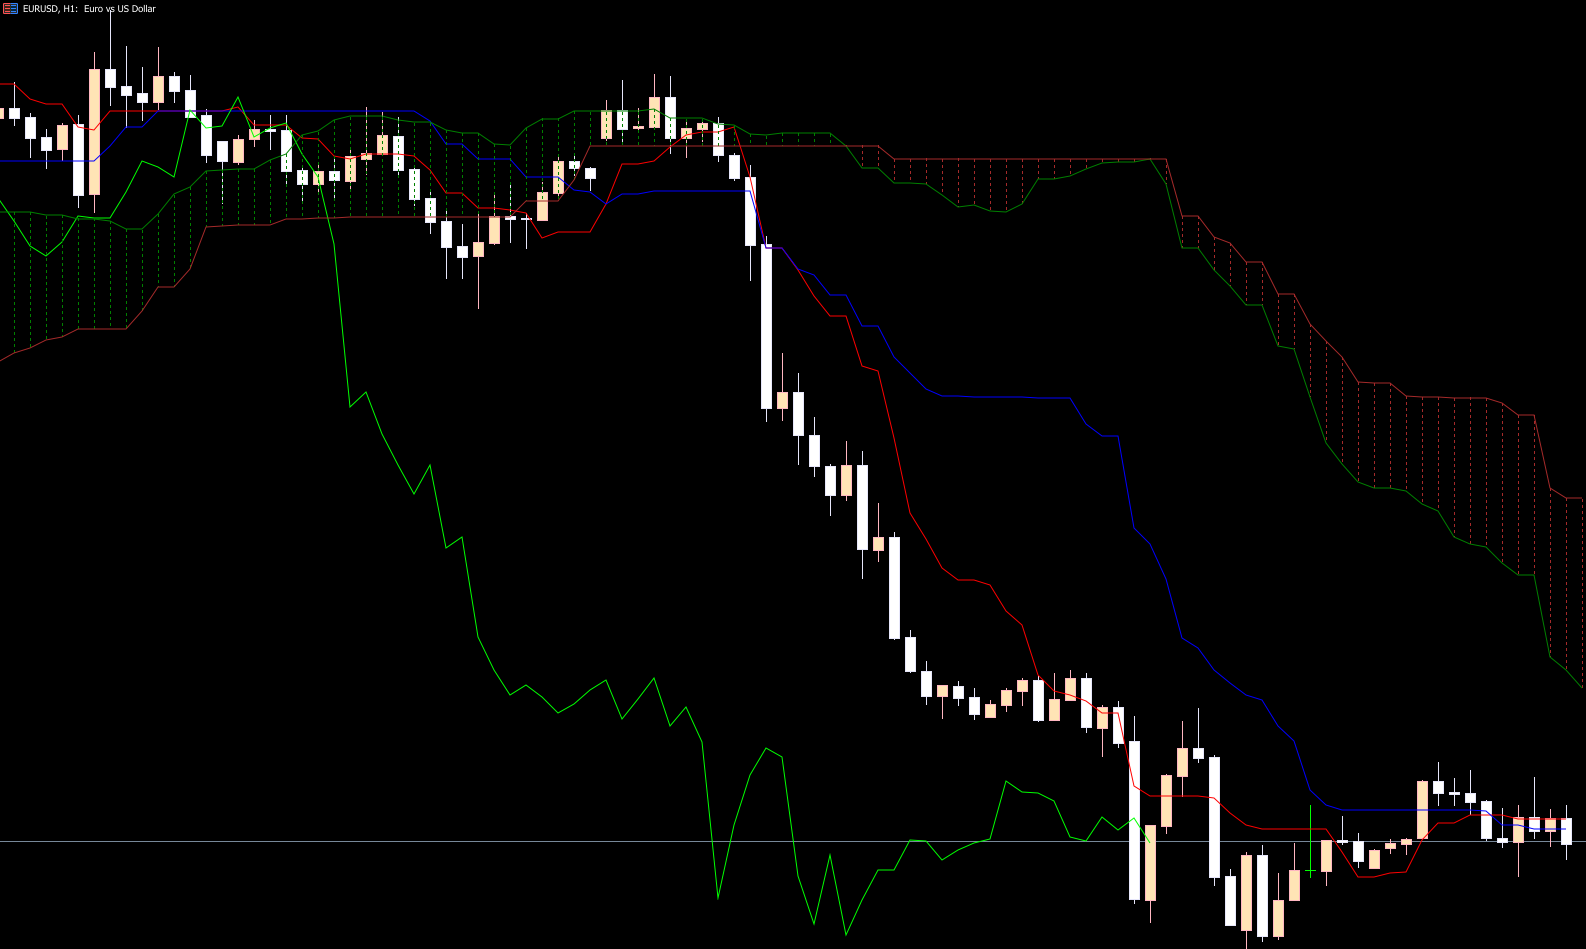
Example Trade
On the EUR/USD chart, Tenkan Sen (green) trends upward, price is above Kijun Sen (magenta), and Chikou Span crosses the price from below. The Kumo cloud provides support, signaling a buy opportunity suitable for entering a long position.
Conclusion
The Ichimoku MTF Alerts Indicator is a versatile tool for forex traders, combining the power of the classic Ichimoku system with multi-timeframe analysis. Its buy and sell signals, Trend Confirmation, and support/resistance mapping make it a must-have for traders looking to improve accuracy and efficiency. Download the Ichimoku MTF Alerts Indicator from IndicatorForest.com and enhance your trading strategy today.
FAQ
5 Downloads
Published:
Nov 12, 2025 00:44 AM
Category: