Unlock Hidden Market Levels with the IMA True Fibs Below Indicator
In the competitive world of technical analysis, finding a unique edge is the difference between consistent profitability and market noise. The IMA True Fibs Below indicator is a specialized trading tool designed for traders who demand precision in identifying support zones and potential trend reversals. By combining the smoothing properties of moving averages with the mathematical accuracy of Fibonacci levels, this indicator provides a dynamic roadmap for navigating complex Price Action.
The Power of Dynamic Fibonacci Support
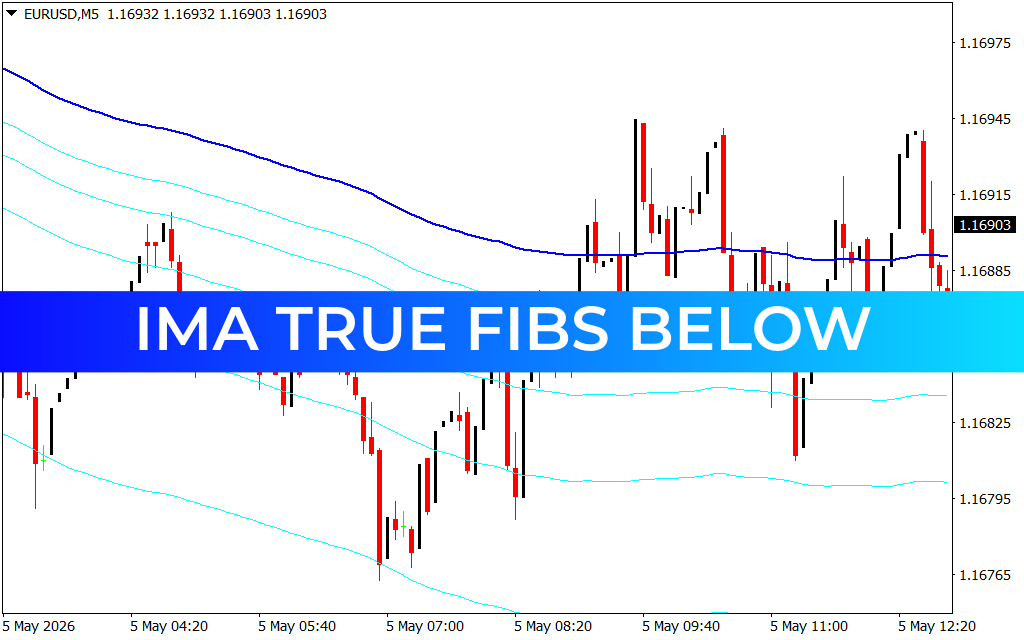
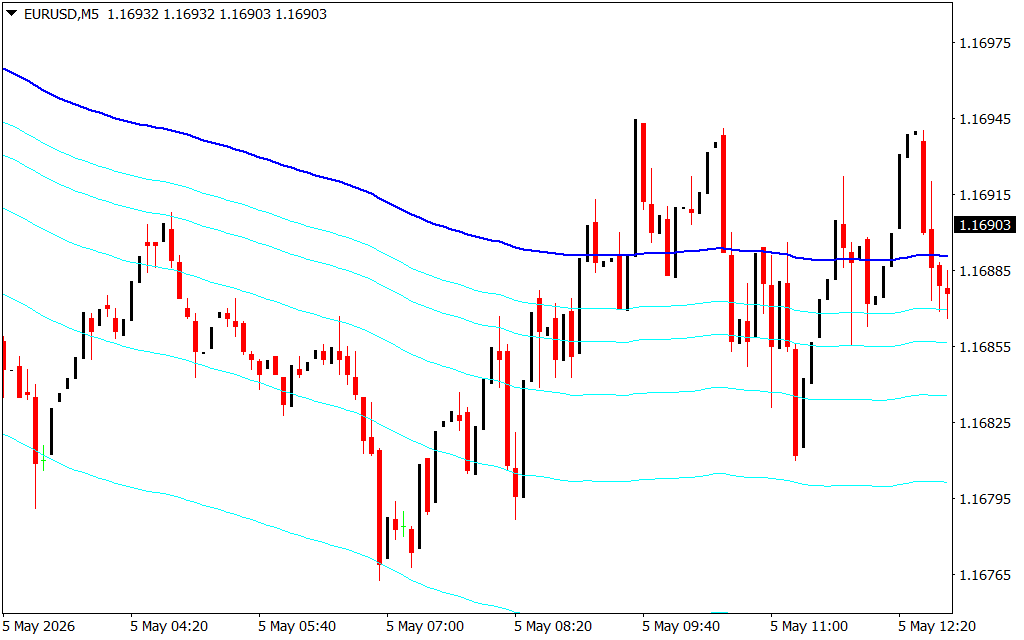
Standard Fibonacci retracement tools require manual placement, which can lead to subjectivity and error. The IMA True Fibs Below automates this process by projecting Fibonacci-based support levels directly from a core moving average. This creates a "banded" effect where each line below the primary trend (the blue line in your chart) represents a specific mathematical probability of price rejection.
Because these levels are dynamic, they adjust in real-time as market volatility shifts. This ensures that your support levels are always mathematically relevant to the current price cycle, rather than being stuck on historical data that the market may have already moved past.
Key Features and Strategic Advantages
- Automated Structural Mapping: The indicator instantly plots multiple layers of support based on Fibonacci ratios, helping you visualize the depth of pullbacks without manual drawing.
- Trend Filter Integration: By using a primary moving average as the anchor, the indicator ensures you are always aware of the broader trend direction while looking for entries at "discounted" prices.
- Objective Exit and Entry Points: The clear visual lines provide definitive targets for take-profits or tight stop-loss placements, reducing the emotional guesswork often associated with trading.
- Versatile Scalping and Day Trading Tool: As shown in the 5-minute chart, the indicator is exceptionally effective for catching quick bounces during intraday sessions.
Trading Strategy: Buying the Dip with Confidence
The most effective way to utilize IMA True Fibs Below is during a primary uptrend. When price experiences a corrective pullback, look for a "rejection" candle (like a pin bar or engulfing pattern) at one of the Fibonacci support lines.
If the price touches a lower band and immediately bounces back toward the primary blue moving average, it confirms that institutional buyers are protecting that specific Fibonacci level. This provides a high-probability entry point with a clearly defined risk-to-reward ratio. By entering trades at these mathematically significant "lows," you position yourself to capture the next impulse wave of the trend.
Conclusion
The IMA True Fibs Below indicator is an essential asset for any trader looking to master price structure. By blending moving average momentum with Fibonacci precision, it removes the subjectivity from technical analysis. Whether you are navigating the Forex markets or trading indices, this tool provides the structural clarity needed to identify where the "true" floor of the market lies.ls, plan entries, and optimize their trading strategy.
2 Downloads
Last Update:
May 06, 2026 01:59 AM
Published:
Jan 27, 2026 02:34 AM
Category: