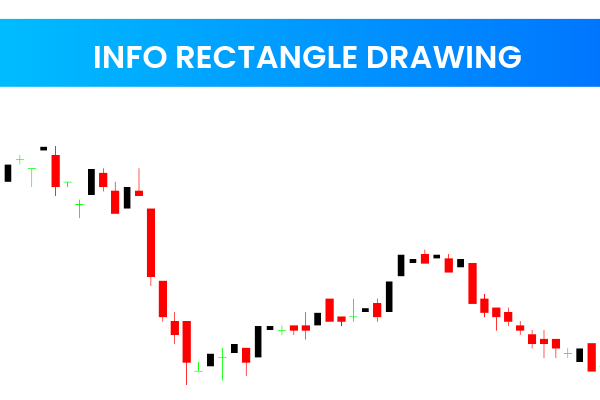
Info Rectangle Drawing Indicator – Identify Support & Resistance Levels Easily
The Info Rectangle Drawing Indicator is a powerful and free Forex tool for the MT4 platform. It helps traders quickly identify key Support And Resistance levels on their charts, which are critical for making informed trading decisions.

This indicator is especially useful for traders who want to monitor Trend Strength, spot breakouts, and identify reversal points. Its simple visual display makes it easy for both novice and experienced traders to use.
How the Info Rectangle Drawing Indicator Works
The indicator works by drawing a rectangle on the chart based on a user-defined period. Within this rectangle, it calculates the average price. This helps traders to:
Identify potential entry and exit points
Monitor trend strength
Detect support and resistance levels
Spot potential breakouts or reversals
Traders can customize the period and style of the rectangle to match their trading preferences, making it a flexible tool for any trading strategy.
Key Features
Rectangle Drawing: Visually highlights key price zones on the chart
Average Price Calculation: Helps identify critical support/resistance levels
Trend Monitoring: Assesses the strength and direction of the current trend
Breakout & Reversal Detection: Alerts traders to potential market moves
Customizable Settings: Adjust rectangle period, color, and style
Ease of Use: Simple interface suitable for all levels of traders
Free MT4 Tool: No cost to download and integrate
Benefits of Using Info Rectangle Drawing
Quickly identify critical price levels for better trade planning
Spot trending markets and ranging markets easily
Helps confirm potential breakouts or reversals before they occur
Reduces guesswork when setting entry, stop-loss, and take-profit levels
Improves trading performance by highlighting actionable areas on the chart
How to Trade with the Info Rectangle Drawing Indicator
Attach to Chart: Add the indicator to your MT4 chart
Set Period: Choose the number of bars or candles to define the rectangle
Observe Rectangle: Watch how the rectangle highlights support/resistance zones
Monitor Average Price: Use it to assess trend strength and entry points
Combine with Other Tools: Enhance trading decisions with trend or momentum indicators
Enter & Exit Trades: Place trades based on rectangle analysis and market confirmation
Who Should Use This Indicator
Beginner Traders: Easy-to-read rectangles simplify support/resistance identification
Trend Traders: Track trend strength and potential reversals
Swing Traders: Plan entry and exit points based on highlighted zones
MT4 Users: Fully compatible with MetaTrader 4 platform
Final Thoughts
The Info Rectangle Drawing Indicator for MT4 is a versatile, easy-to-use, and free tool that helps traders identify key support and resistance levels, monitor trends, and spot potential breakouts or reversals. Its visual rectangle and average price calculation make it a valuable addition to any Forex trader’s toolkit.
📊 Download the Info Rectangle Drawing Indicator today and start making more informed trading decisions!
Published:
Dec 28, 2025 01:00 AM
Category: