Maximizing Momentum Precision: The Inverse Fisher Transform Indicator
In technical analysis, standard momentum oscillators like the Relative Strength Index (RSI) or Stochastic Oscillator are highly valued for identifying market extremes. However, they share a major operational flaw in modern financial markets: they often spend too much time wandering aimlessly in neutral territory or hovering mid-range during critical market shifts. This lagging, sluggish response can cause retail day traders to miss the absolute beginning of an explosive move. To resolve this structural limitation, advanced mathematical models are required. The Inverse Fisher Transform (IFT) indicator completely changes the equation, supercharging traditional momentum tools to deliver crisp, clear execution triggers.
Originally introduced to the trading world by veteran rocket scientist and technical analyst John Ehlers, the Inverse Fisher Transform applies a specialized smoothing algorithm to raw price momentum. The result is an incredibly responsive, zero-lag oscillator that aggressively pushes values toward its structural extremes, making market turning points instantly recognizable.
Decoding the Square-Wave Mechanics of the Inverse Fisher Transform
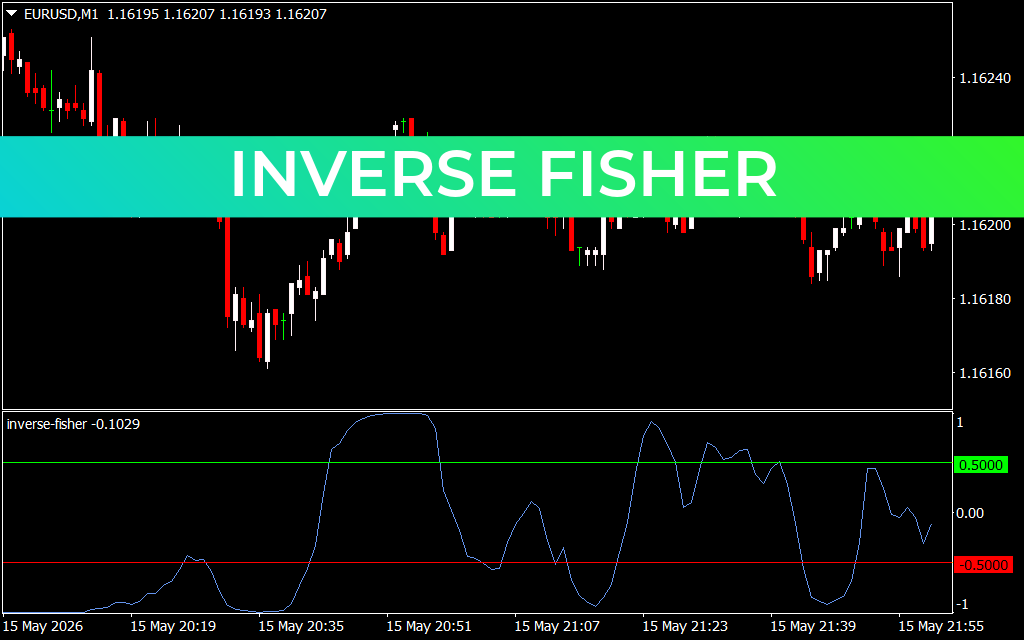
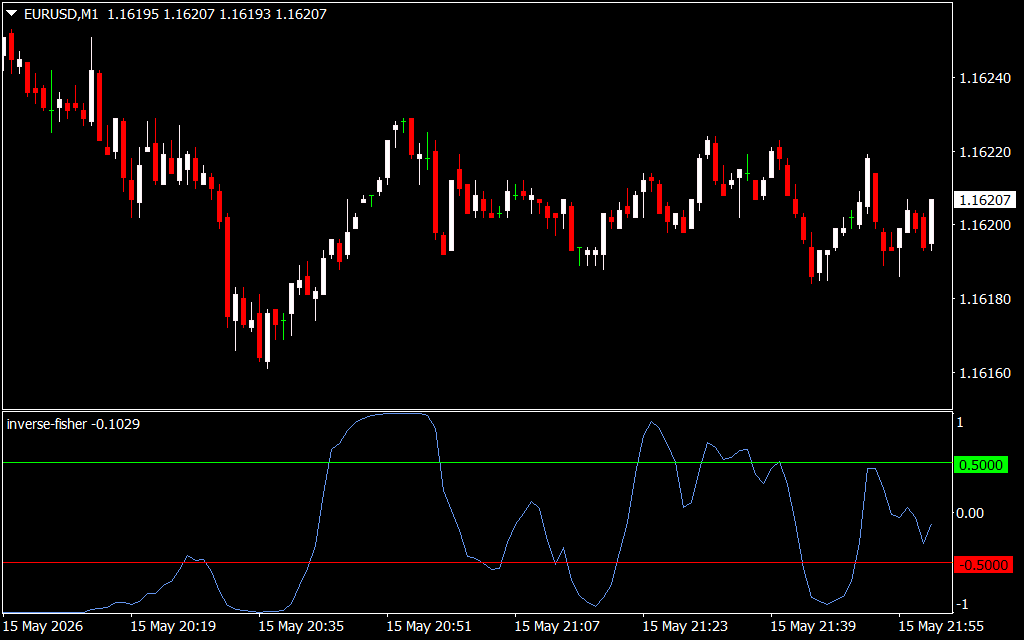
The core benefit of the Inverse Fisher Transform lies in its unique visual output. While a standard RSI moves in fluid, unpredictable waves, the IFT compresses values into a "square-wave" signature. When loaded onto a liquid currency pair like the EUR/USD on a 1-minute (M1) chart, the indicator operates out of a clear sub-window featuring three critical operational zones:
- The Overbought Saturation Boundary (Above +0.5): When institutional buyers aggressively fuel a bullish expansion, the IFT line rapidly surges and flattens out at the very top of the window, near the +1.0 limit. A sharp downward cross back below the +0.5 baseline acts as a definitive visual trigger that buying pressure has exhausted, signaling an optimal short or exit window.
- The Neutral Equilibrium Line (0.00 Baseline): The zero line acts as the ultimate directional referee. Unlike traditional oscillators that drift slowly across mid-levels, the IFT cuts through the 0.00 baseline almost vertically, providing an instantaneous confirmation of a shifting intraday micro-bias.
- The Oversold Accumulation Floor (Below -0.5): Conversely, when intense institutional liquidations hit the market, the oscillator drops sharply to the absolute floor of the layout, flattening out near -1.0. The moment the line hooks upward and crosses back above the -0.5 threshold, it highlights institutional absorption—providing a high-probability signal to execute long scalp entries.
Meticulously Optimized for High-Frequency Scalping Systems
Because of its rapid, decisive transitions, the Inverse Fisher Transform utility is an indispensable tool for fast-paced trading strategies like 5-minute Scalping or sixty-second micro-trades. It eliminates the visual ambiguity that often plagues retail trading screens by translating messy, choppy price feeds into an objective, rule-based execution roadmap.
Instead of chasing a sudden price spike blindly and risking getting trapped by a fakeout, you look directly at your indicator sub-window. The sharp, mathematical boundaries ensure you enter a trade right as momentum accelerates and exit the moment the cycle rolls over. By embedding this advanced smoothing engine into your MetaTrader terminal, you clean up your workspace and isolate your trading capital from random market noise.
2 Downloads
Last Update:
May 17, 2026 16:42 PM
Published:
Jan 20, 2026 16:29 PM
Category: