The JX Parabolic Regression Stop and Reverse indicator is a powerful technical tool for channel traders. Designed with both linear and dynamic regression channels, it helps traders identify entry and exit points with precision. Suitable for both novice and experienced traders, this indicator works effectively on all financial instruments and timeframes.

How the JX Parabolic Regression Stop and Reverse Indicator Works
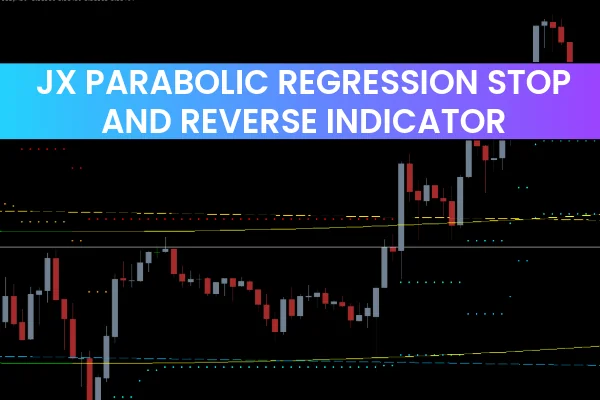
At the core of this indicator are two channels:
Trendline Channel – Features a golden line that indicates the current trend direction. A steeper slope signals a stronger trend.
Dynamic Regression Channel – Uses adaptive Support And Resistance levels calculated with a root mean square deviation and Fibonacci coefficient. These levels are shown using red and blue dots.
Additional features include:
Curved regression channel – Predicts dynamic support and resistance levels to anticipate future price movements.
Color-coded trend bands – Yellow during an uptrend, green during bearish momentum.
Trading Signals with JX Parabolic Regression Stop and Reverse
Buy Signal
Look for an upward-slanting channel.
Wait for price to approach the lower band (support) of the channel.
Enter a buy trade once a bullish pattern forms.
Stronger buy signals occur when the nonlinear regression channel crosses above the golden line.
Sell Signal
Watch for price touching the upper band of the channel.
The nonlinear regression channel should cross below the golden line from above.
Enter a sell trade as the trend confirms.
Example of JX Parabolic Regression Stop and Reverse Trading
In the CAD/JPY chart, notice how the price touches the lower linear channel and the regression channel crosses above the golden line. This alignment of channels slanting upwards indicates a bullish trend, signaling a long entry position.
Similarly, during a downtrend, the channels slant downward and the regression line crosses below the golden line, signaling a sell entry.
Conclusion
The JX Parabolic Regression Stop and Reverse indicator is an ideal tool for channel traders. By combining linear and regression channels, it allows traders to accurately detect trends, entry points, and dynamic support/resistance levels. Its adaptive algorithm ensures reliable trading signals across multiple instruments and timeframes.
FAQ
7 Downloads
Published:
Nov 14, 2025 11:07 AM
Category: