Mastering Price Extremes: A Guide to the Kairi Indicator
In the volatile world of Forex and CFD trading, the most common trap traders fall into is buying at the peak of a move or selling right at the bottom. The Kairi Indicator is a sophisticated technical tool designed specifically to identify when price has moved too far from its mean—a state known as being "overextended." By calculating the percentage deviation of the current price from a Simple Moving Average (SMA), it provides an objective, data-driven approach to mean reversion trading.
How the Kairi Indicator Works
At its core, the Kairi indicator measures the "distance" between the current price and its average over a specific period. It is based on the premise that regardless of how strong a trend is, price is like a rubber band; the further it stretches away from its average, the higher the probability that it will "snap" back toward the mean.
- Positive Values: When the Kairi line rises above the zero level, it indicates that the price is trading at a premium relative to its recent average. High positive values often suggest that an uptrend is overextended and may be ripe for a correction or reversal.
- Negative Values: Conversely, when the line dips below the zero level, the price is trading at a discount. Significant negative values alert traders that the asset is oversold, indicating that a bullish mean-reversion move could be imminent.
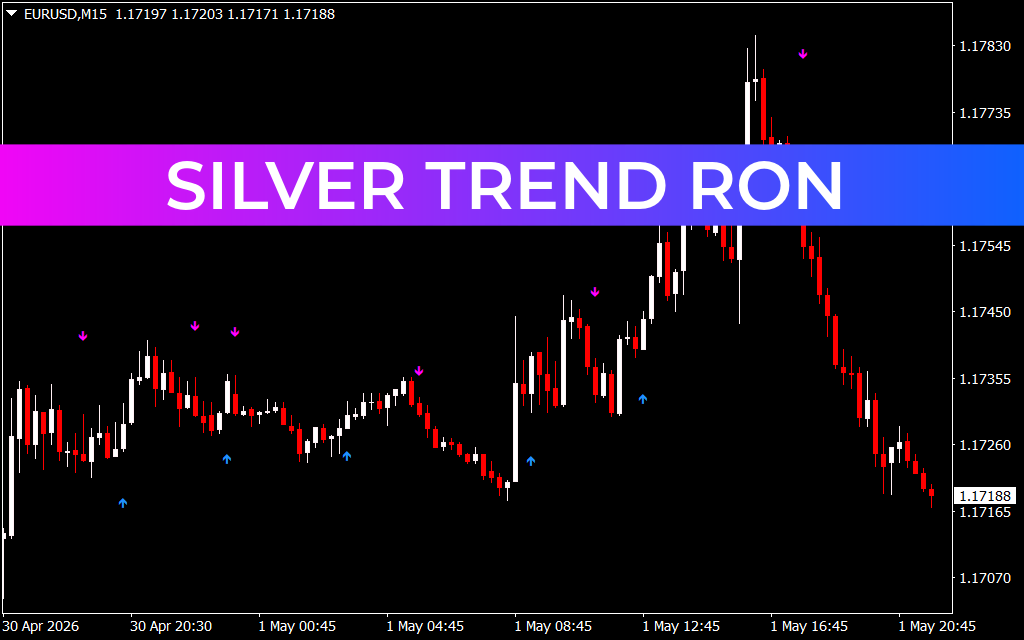
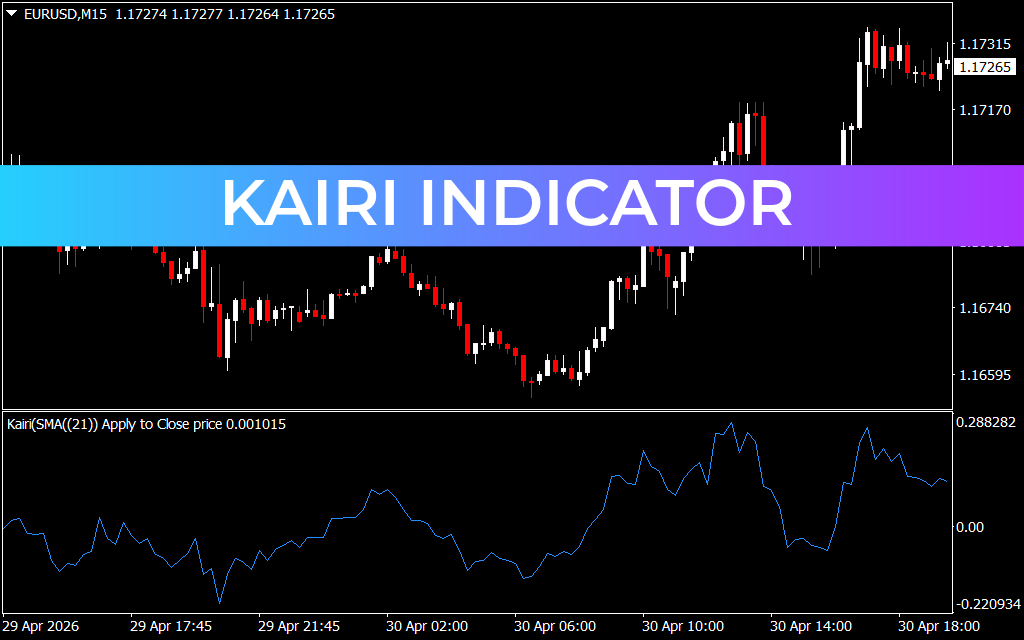
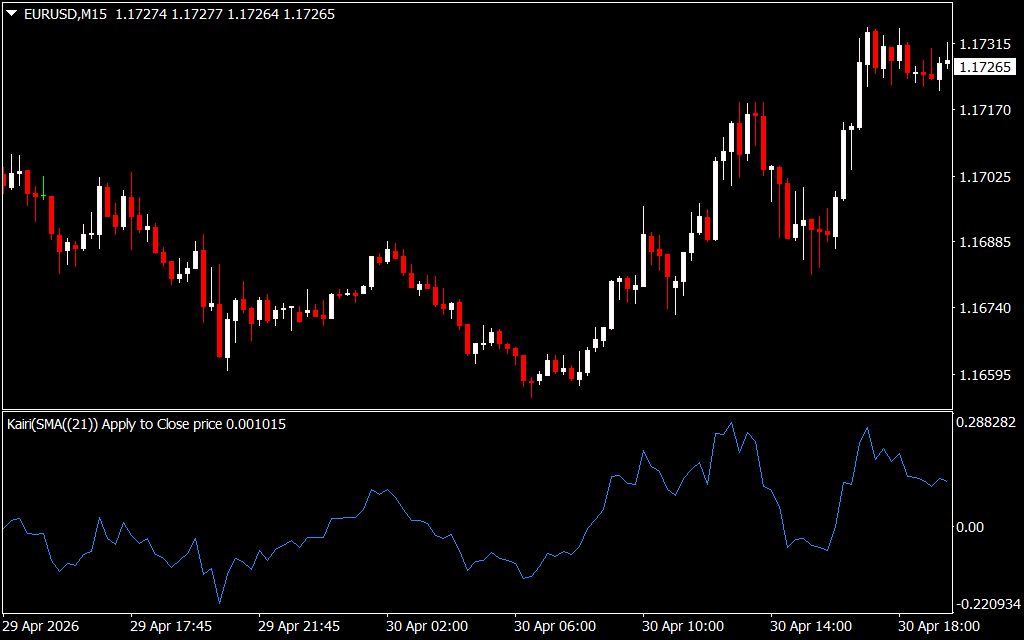
Analyzing Mean Reversion on the M15 Timeframe
As illustrated in the EURUSD M15 chart, the Kairi indicator acts as a vital "context" layer. On the 15-minute timeframe, trends can develop quickly, but they rarely move in a straight line forever.
The Kairi indicator helps you visualize these cycles of expansion and contraction. When you see the Kairi line hitting an extreme peak or trough, it acts as a warning sign. While the trend might continue for a few more bars, the indicator signals that the risk of a "snap-back" is rising significantly. By waiting for the Kairi line to reach an extreme level and then looking for a candlestick reversal pattern, you can enter trades at high-probability points where the risk-to-reward ratio is heavily in your favor.
Strategic Integration for Traders
The Kairi indicator is exceptionally versatile and works best when used to complement your existing strategy:
- Reversal Timing: Instead of trying to pick tops and bottoms blindly, use the Kairi extremes to validate your reversal signals. If price hits a resistance level and the Kairi indicator is simultaneously at a historical peak, the probability of a successful short trade is much higher.
- Trend Exhaustion: Use it to manage your active trades. If you are in a long position and the Kairi indicator hits an extreme positive level, it is a signal to consider taking partial profits or tightening your stop-loss, as the market is likely to pull back to the mean.
- Dynamic Filtering: Avoid entering new long trades when the Kairi is at an extreme high, even if the trend looks strong. Waiting for a "dip" back toward the zero line often provides a much better entry point.
By transforming price deviation into a simple, readable line, the Kairi indicator removes the guesswork from mean reversion, providing a clear roadmap for when to stay in the market and when to anticipate a turn.
1 Download
Last Update:
May 04, 2026 10:19 AM
Published:
Jan 28, 2026 17:36 PM
Category: