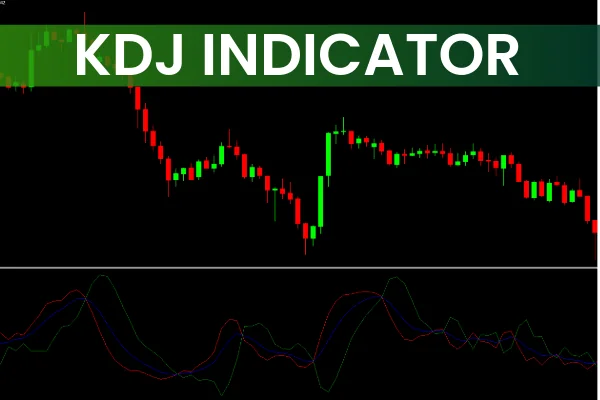
The KDJ Indicator for MT4 is an enhanced version of the traditional Stochastic Oscillator, designed to identify overbought and oversold conditions in the forex market. By adding a third J line to the standard K and D lines, the indicator provides more precise signals, helping traders make informed decisions about entries and exits.
How the KDJ Indicator Works
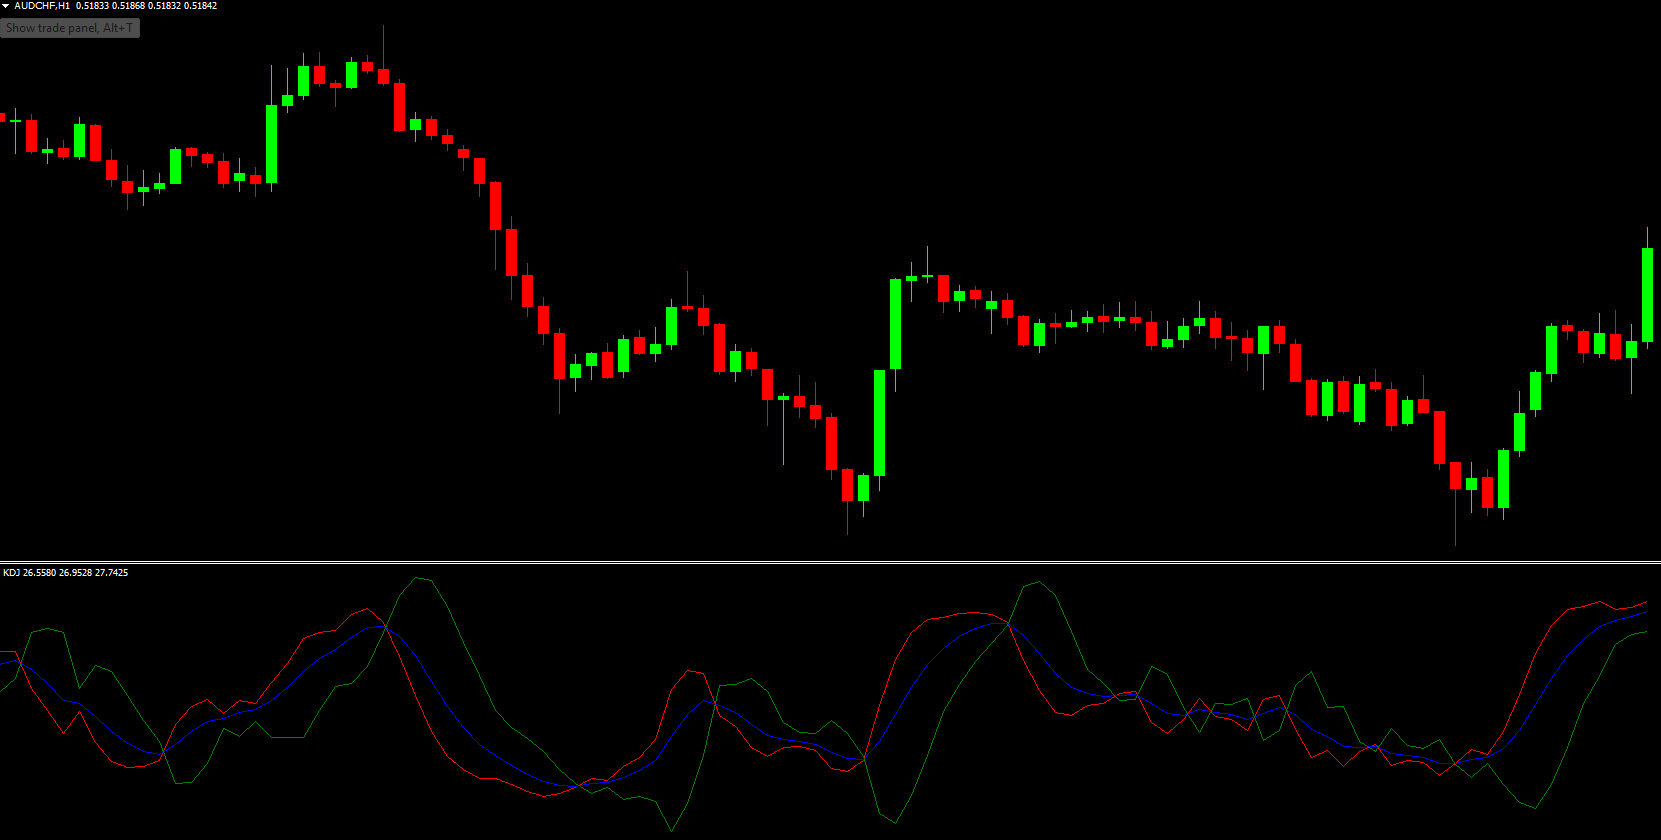
The KDJ Indicator oscillates between 0 and 100, indicating potential market reversals:
Overbought Zone: When the J line crosses above the K and D lines, it signals that the market is overbought. Traders can consider taking short positions or exiting long trades.
Oversold Zone: When the J line crosses below the K and D lines, it indicates an oversold market. Traders may enter long positions or exit short trades.
The indicator is effective across all timeframes but works best on longer timeframes to minimize market noise and false signals.
Using the KDJ Indicator for BUY/SELL Signals
To use the KDJ Indicator effectively:
Monitor the J Line: Look for crossovers of the J line with the K and D lines to identify overbought or oversold conditions.
Entry and Exit Points: Take long positions in the oversold zone and short positions in the overbought zone.
Signal Confirmation: While the indicator works well independently, combining it with trend indicators like Moving Averages or Bollinger Bands can improve signal accuracy.
For example, the EUR/USD H4 chart shows how the KDJ Indicator marks overbought and oversold zones, providing clear BUY and SELL signals for traders.
Benefits of the KDJ Indicator
Detects overbought and oversold conditions more accurately than the standard Stochastic Oscillator
Includes an additional J line for better signal clarity
Works on any timeframe, especially effective on longer charts
Free to download and simple to install on MT4
Call to Action
Enhance your forex trading strategy with the KDJ Indicator for MT4. Download it for free from IndicatorForest.com and start identifying overbought and oversold zones effectively.
FAQ
6 Downloads
Published:
Nov 21, 2025 00:16 AM
Category: