The Kijun Tenkan Indicator for MT4 is one of the most effective tools for analyzing market trends and momentum. Built on the core principles of the Ichimoku Kinko Hyo system, it uses two primary components—the Tenkan-sen (Conversion Line) and the Kijun-sen (Base Line)—to generate high-probability buy, sell, or exit signals. Traders around the world rely on the Kijun Tenkan strategy to make data-driven trading decisions in both trending and ranging markets.
What Is the Kijun Tenkan Strategy?
The Kijun Tenkan strategy revolves around the interaction between the Tenkan-sen and Kijun-sen lines. These lines represent short-term and medium-term market averages:
Tenkan-sen (Conversion Line): Calculated using a 9-period price average.
Kijun-sen (Base Line): Calculated using a 26-period price average.
When the Tenkan line crosses above the Kijun line, it signals bullish momentum—a potential buying opportunity. Conversely, when the Tenkan line crosses below the Kijun line, it indicates bearish momentum and may trigger a selling signal.
This simple crossover mechanism allows traders to quickly identify trend reversals or continuation patterns.
How the Kijun Tenkan Indicator Generates Buy and Sell Signals
Bullish Signal (Buy Setup)
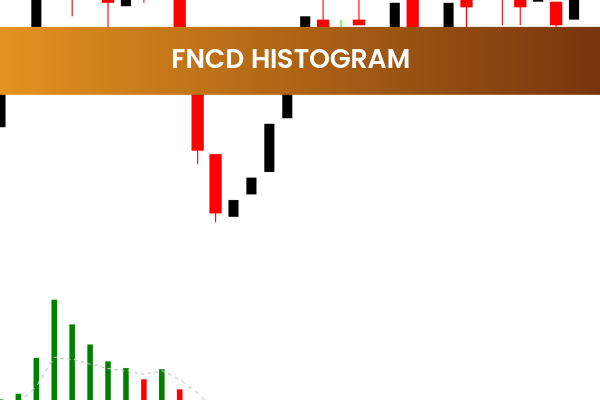
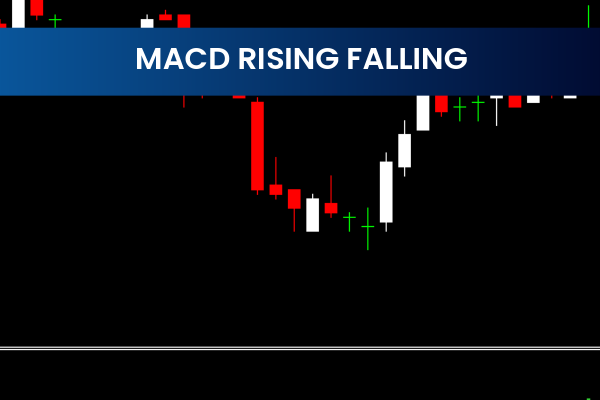
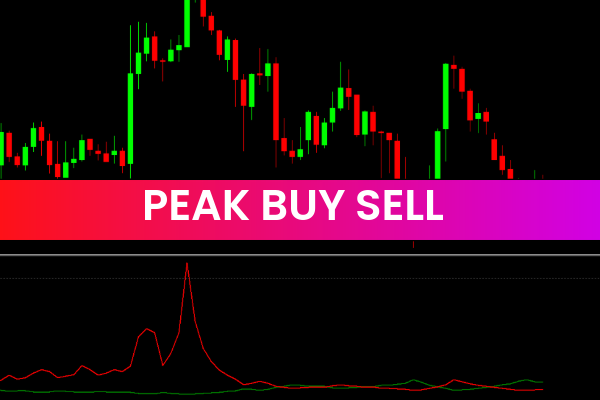
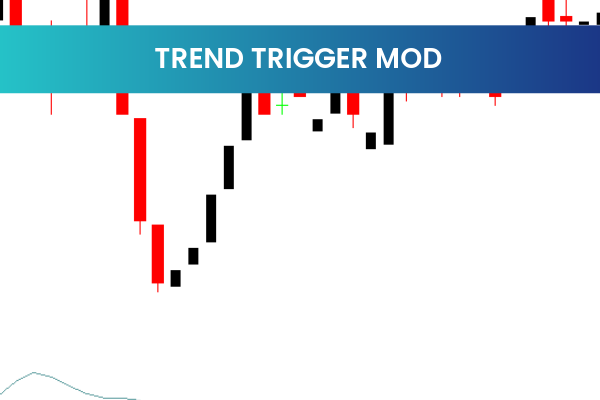
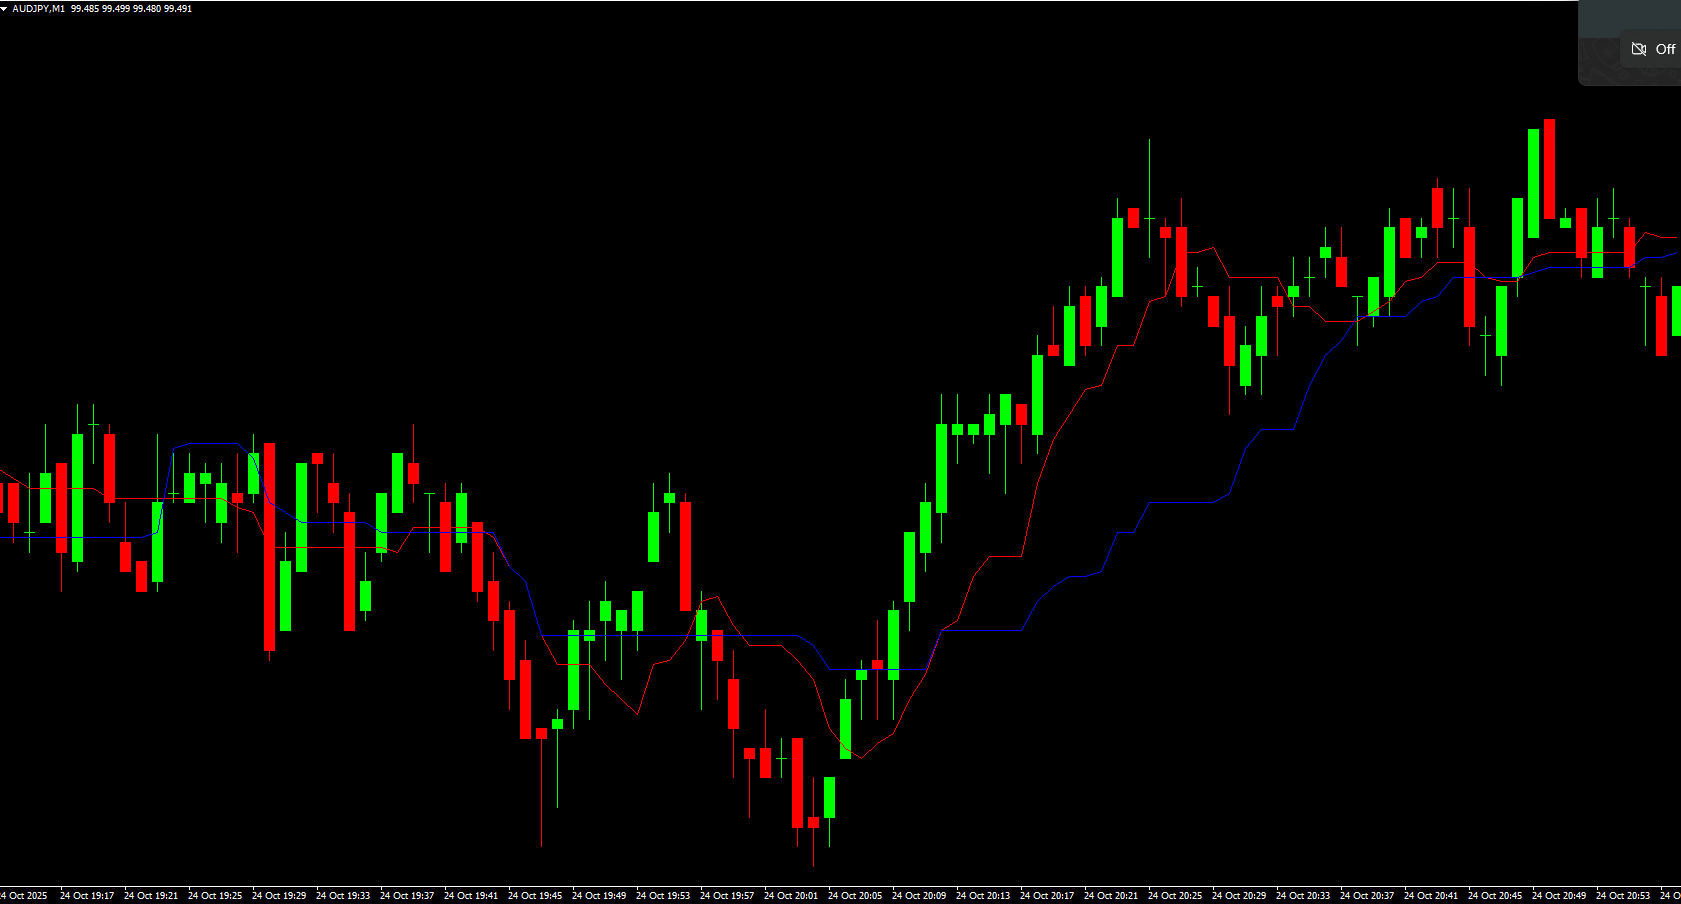
A buy signal is generated when the Tenkan-sen (red line) crosses above the Kijun-sen (blue line). This crossover shows that short-term Price Action is gaining strength and may continue upward. Traders often confirm this signal with price action analysis or other technical indicators such as the Relative Strength Index (RSI) or Moving Average Convergence Divergence (MACD).
Bearish Signal (Sell Setup)
A sell signal occurs when the Tenkan-sen crosses below the Kijun-sen. This movement indicates weakening momentum and the possibility of a downtrend. As with the buy setup, traders can validate the signal using additional tools or candlestick patterns.
Using these crossovers strategically can help traders identify entry and exit points with improved precision.
Why Use the Kijun Tenkan Indicator in MT4?
The Kijun Tenkan Indicator for MT4 offers several benefits for forex traders:
Clear visual representation of market momentum.
Reliable crossover signals for buy/sell decisions.
Compatibility with multiple timeframes, from short-term Scalping to long-term trading.
Ideal for traders of all levels, from beginners to advanced.
Moreover, this indicator can be integrated with other technical tools—such as Ichimoku Cloud, Support And Resistance zones, or moving averages—to enhance trade accuracy.
Practical Trading Tips for the Kijun Tenkan Strategy
Combine with trend confirmation tools: Use moving averages or Ichimoku Cloud to validate the crossover signals.
Avoid sideways markets: The indicator works best in clearly trending conditions.
Use proper risk management: Always place stop-loss orders below recent swing lows (for buy trades) or above swing highs (for sell trades).
Backtest before live trading: Test the indicator on historical data to understand its performance in different market conditions.
Conclusion
The Kijun Tenkan Indicator for MT4 is a simple yet powerful trend-following tool that enables traders to identify market direction and potential entry/exit points efficiently. Whether you’re a beginner or an experienced trader, this indicator can help refine your trading strategy and boost accuracy when combined with other analysis methods.
To explore and download the Kijun Tenkan Indicator for MT4, visit IndicatorForest.com and access a wide collection of free and premium forex indicators.
FAQ
1 Download
Published:
Dec 18, 2025 13:29 PM
Category: