Breaking the Range Trap: Maximizing Breakout Efficiency with the Konsolidierung RSI V1 Indicator
In the high-frequency world of day trading and intraday Scalping, a primary obstacle to sustainable profitability is executing orders inside a consolidation zone. Range-bound markets look highly enticing to standard oscillators, yet they routinely trap retail traders with false crossovers and exhausting sideways drift. The Konsolidierung RSI V1 Indicator for MT4 and MT5 addresses this systemic issue. By re-engineering the classic Relative Strength Index formula to isolate flat ranges from active momentum expansions, this specialized indicator provides technical traders with clear boundaries to stand aside during a low-volatility squeeze and strike the market when institutional volume returns.
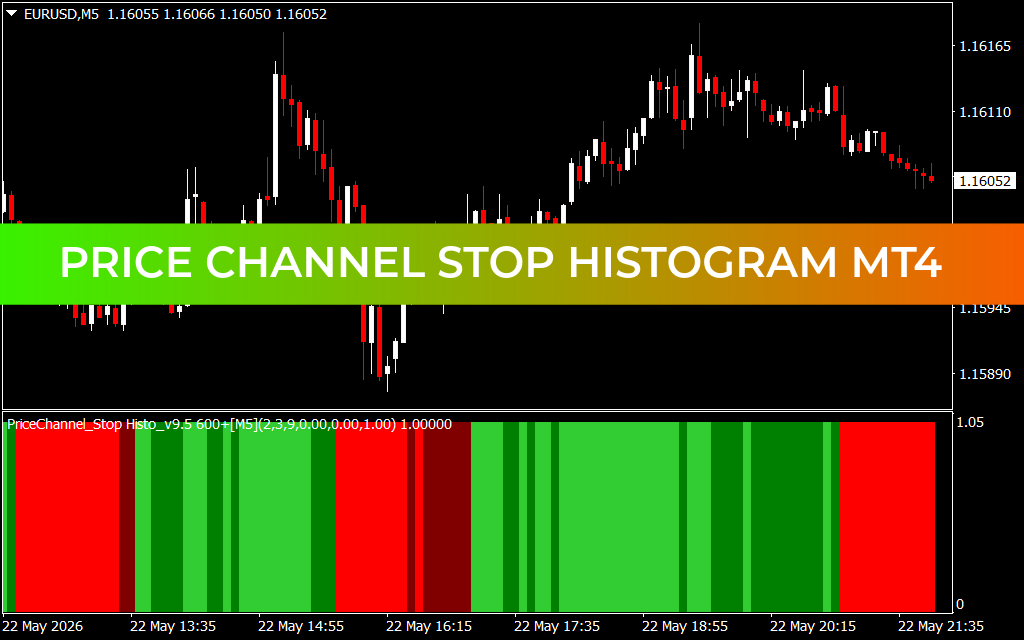
Deciphering the Squeeze Profile on the EUR/USD M5 Chart
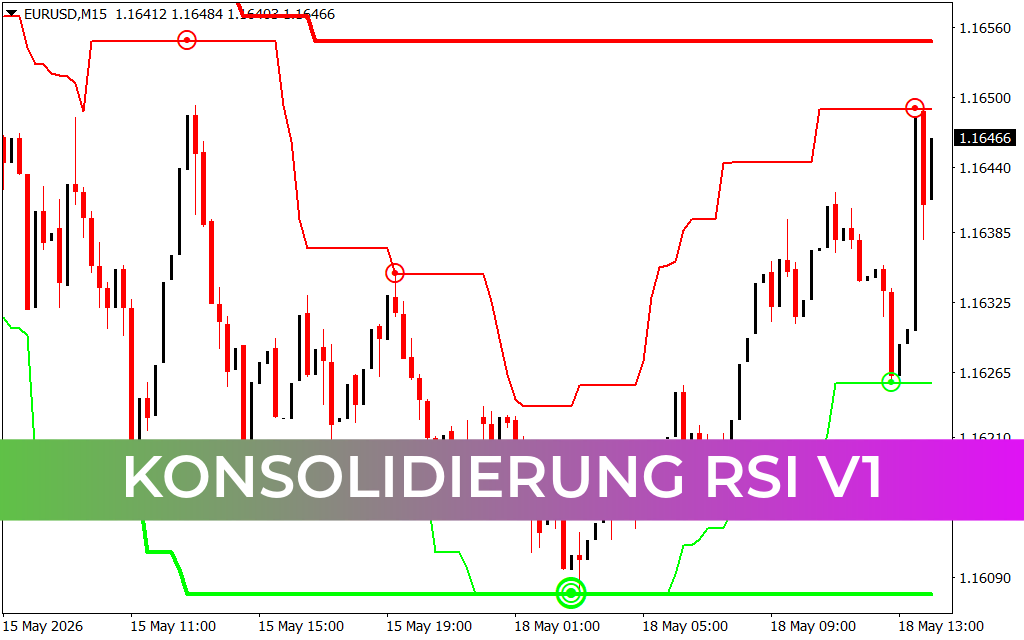
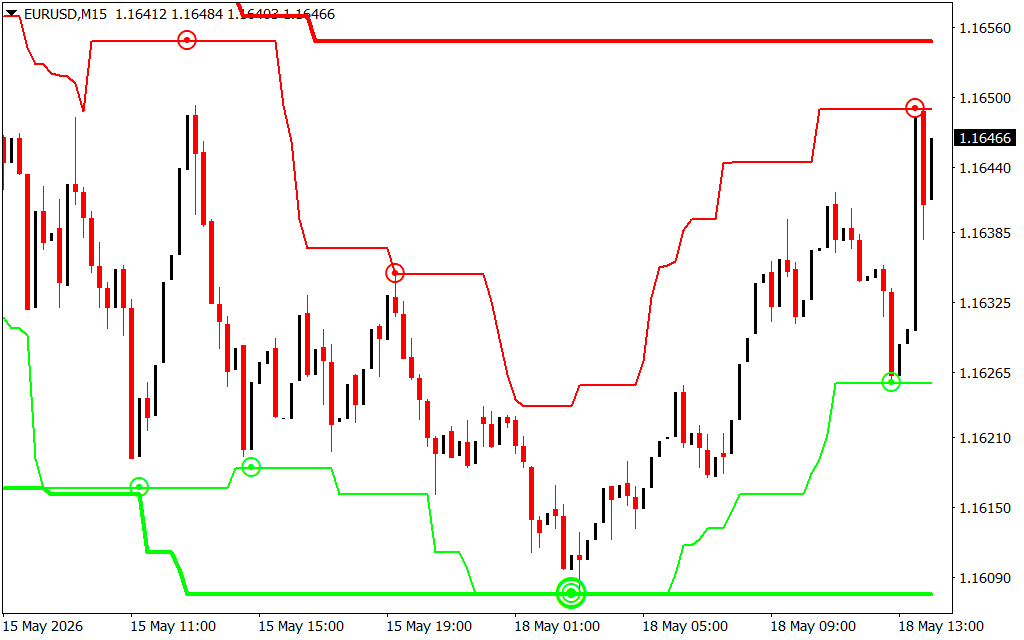
The attached EUR/USD 5-minute (M5) chart showcases how the indicator serves as an objective market filter during volatile intraday trading sessions. Located in the sub-window underneath the primary candlesticks, the tool maps momentum by using two tightly bound, intertwined lines—one green and one red—oscillating rapidly within a specific vertical grid.
During the opening phase of the May 18 session, the currency pair entered an extended accumulation squeeze, compressing inside a tight horizontal range between 1.16135 and 1.16195. In typical charting configurations, conventional oscillators cycle back and forth endlessly, generating dozens of conflicting buying and selling signals.
Notice how the Konsolidierung RSI V1 matrix handles this tight space: the red and green vectors continuously overlap in a rapid, flat-lined sequence. This distinct signature alerts algorithmic traders and scalpers to a consolidated, flat market state. Standing aside during this phase protects trading capital from being eroded by choppy spreads and minor retail stop hunts.
Exploiting True Volatility Expansions and Trend Rotations
The true tactical utility of the Konsolidierung RSI V1 indicator is revealed the exact moment the market transitions from a tight consolidation phase into a strong directional expansion leg.
Near the 07:40 session marker, the currency pair accumulated enough buy-side liquidity to break above localized structural resistance. As the vertical markup leg accelerated, the lines inside the indicator sub-window completely decoupled. The green line surged straight to the upper boundary, while the red line remained pinned below, forming an expansive, hollow gap.
This dramatic physical separation confirms a powerful breakout, prompting momentum traders to confidently enter buy positions near 1.16235. The asset proceeded to embark on a massive upward run that peaked past the 1.16435 macro ceiling.
Currently trading near 1.16297, the lines have crossed and compressed back together, signaling that the downward trend rotation has slowed into a fresh consolidation block. By adding the Konsolidierung RSI V1 indicator to your daily layout, you remove subjective bias from range identification, optimize your entry speed at the birth of major trends, and execute trades with institutional-grade structural clarity.
3 Downloads
Last Update:
May 18, 2026 17:15 PM
Published:
Jan 19, 2026 21:18 PM
Category: