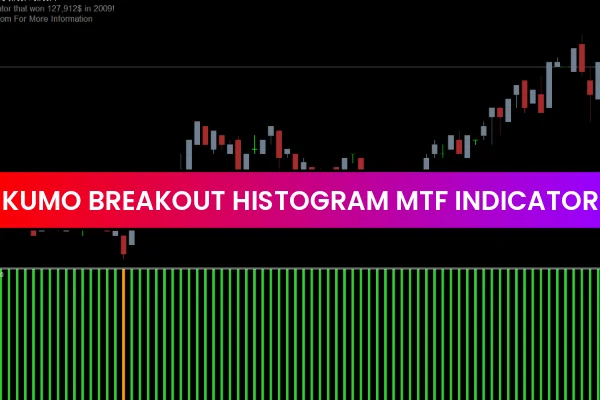
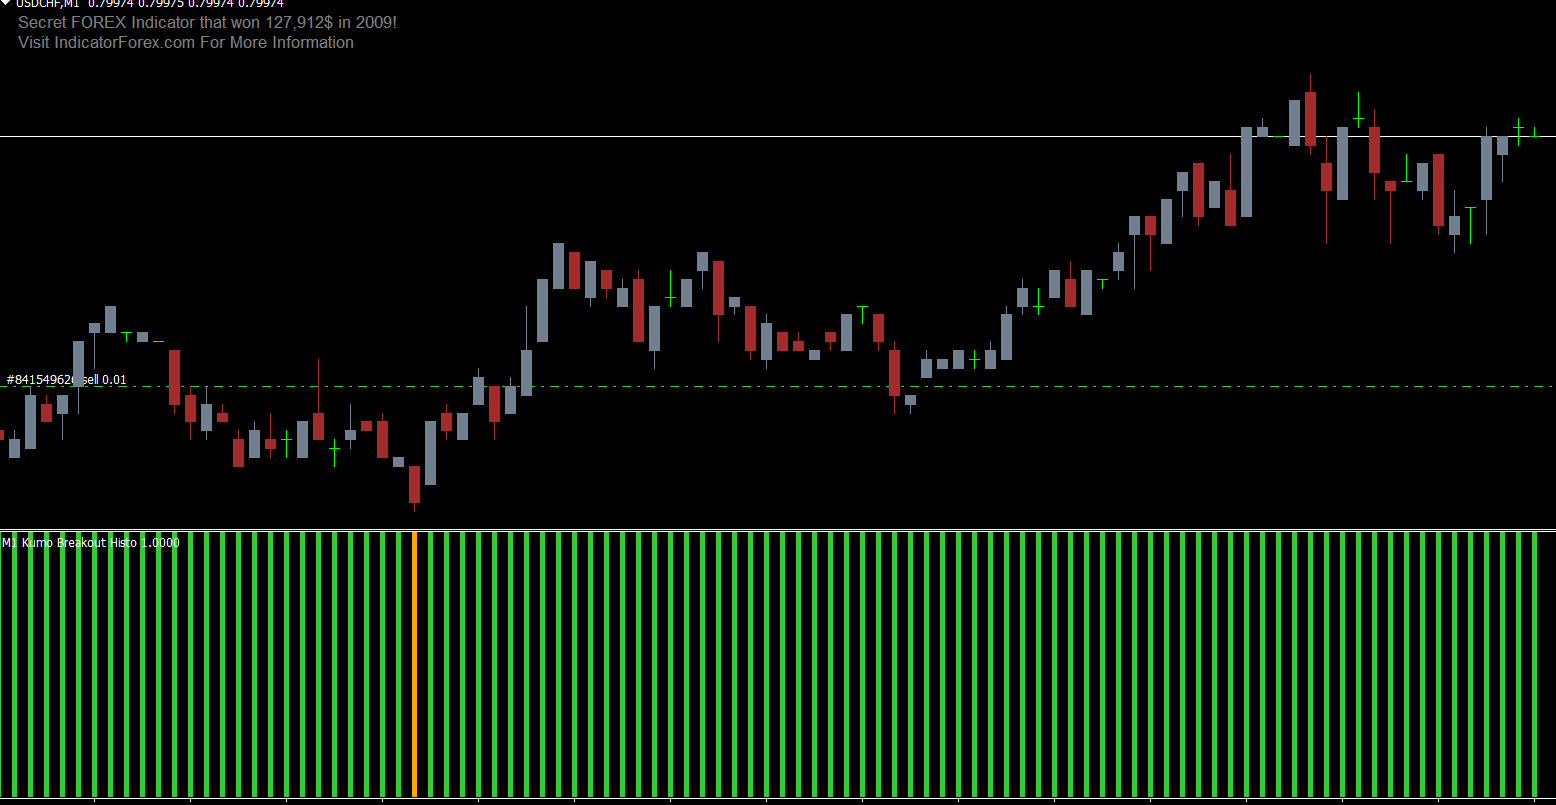
The Kumo Breakout Histogram MTF indicator for MT4 is a powerful enhancement of the classic Ichimoku system. It provides forex traders with histogram-based visual signals and alerts to identify bullish, bearish, and neutral market conditions. By understanding the relationship of price with the Ichimoku cloud, traders can confidently decide to buy, sell, or exit positions.
This indicator is ideal for both novice and advanced traders who rely on Ichimoku cloud strategies. Additionally, it works effectively on intraday charts, as well as daily, weekly, and monthly timeframes, making it a versatile addition to any forex trading toolkit.
Features of the Kumo Breakout Histogram MTF Indicator
Histogram-Based Signals: Green bars indicate bullish momentum, red bars show bearish conditions, and orange bars signal neutrality.
Multi-Timeframe Calculation: Calculates Ichimoku cloud values from up to three higher timeframes than the current chart.
Alerts: Provides notifications for potential buy, sell, or exit points.
Trend Following: Ideal for holding positions until an opposite or neutral signal appears.
User-Friendly: Easy to install and suitable for all skill levels.
By incorporating higher timeframe Ichimoku cloud values, the indicator helps traders align trades with long-term trends while still taking advantage of intraday movements.
How to Trade Using the Kumo Breakout Histogram MTF Indicator
Buy Setup (Bullish Signal)
Wait for the histogram to turn green, indicating a bullish market.
Enter a buy position at the current price.
Place a stop-loss below the previous swing low.
Hold the trade until either an opposite (red) or neutral (orange) histogram signal appears.
Sell Setup (Bearish Signal)
Wait for the histogram to turn red, indicating a bearish market.
Enter a sell position at the current price.
Place a stop-loss above the previous swing high.
Hold the trade until a green or neutral histogram bar appears.
Neutral Market (Orange Histogram)
Avoid entering new trades when the histogram turns orange, as this indicates market indecision.
Consider using this as a signal to exit existing trades or wait for a clear trend to develop.
Advantages of Using the Kumo Breakout Histogram MTF Indicator
Multi-Timeframe Insight: Helps formulate trading strategies that consider both short-term and long-term trends.
Visual Clarity: Histogram bars make market conditions easy to interpret at a glance.
Alerts for Key Signals: Notifications reduce the need to constantly monitor charts.
Versatile Application: Works across multiple currency pairs and timeframes.
Stand-Alone or Confluence Tool: Can be used alone or in combination with other indicators for enhanced trading precision.
This indicator allows traders to stay in trending markets longer while avoiding choppy conditions. Its multi-timeframe approach ensures trades are aligned with broader market dynamics, improving the probability of successful trades.
Conclusion
The Kumo Breakout Histogram MTF Indicator for MT4 is an advanced Ichimoku-based tool that visually identifies bullish, bearish, and neutral market conditions. By leveraging multi-timeframe cloud analysis, traders can enhance their decision-making and apply precise entry, exit, and risk management strategies.
Whether used as a stand-alone indicator or alongside other technical analysis tools, this MT4 indicator can significantly improve your trading workflow. Best of all, it is free to download and easy to install, making it accessible for all traders.
FAQ
13 Downloads
Published:
Dec 11, 2025 01:15 AM
Category: