Advanced Momentum Filtering with the Laguerre ROC Indicator
In financial trading, measuring the speed of price changes—commonly known as the Rate of Change (ROC)—is a core method for identifying overextended markets and explosive breakout momentum. However, standard momentum oscillators often suffer from a classic technical trade-off: if you make them too sensitive, they generate a massive amount of market noise and false signals; if you smooth them out using traditional moving averages, they become lagging and unreactive. The Laguerre ROC indicator solves this fundamental issue by applying advanced time-filtering mechanics to live price streams on MetaTrader platforms.
The Innovation of Laguerre Time Filters
To understand why the Laguerre ROC indicator provides a superior view of Trend Strength, it is necessary to examine how it processes historical price information. Traditional oscillators rely on linear time intervals, treating every past candle with uniform mathematical weight.
The Laguerre ROC indicator utilizes a non-linear Laguerre filter, a mathematical concept heavily used in digital signal processing. This filter distorts time programmatically, allowing the indicator to place a much higher algorithmic priority on recent, immediate Price Action while smoothly tapering off older data.
- High Sensitivity: It responds instantly to sudden institutional volume injections and volatile price expansions.
- Low Noise: It holds a smooth, legible path during minor intraday consolidations, preventing retail traders from overtrading or getting chopped out of valid setups.
Analyzing the Sub-Window Layout and Momentum Waves
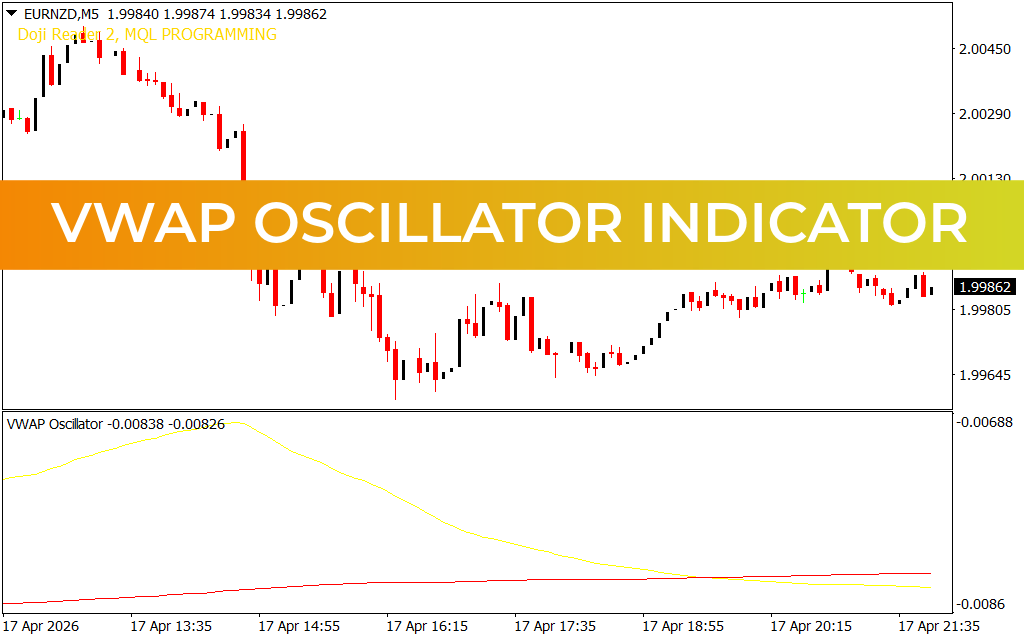
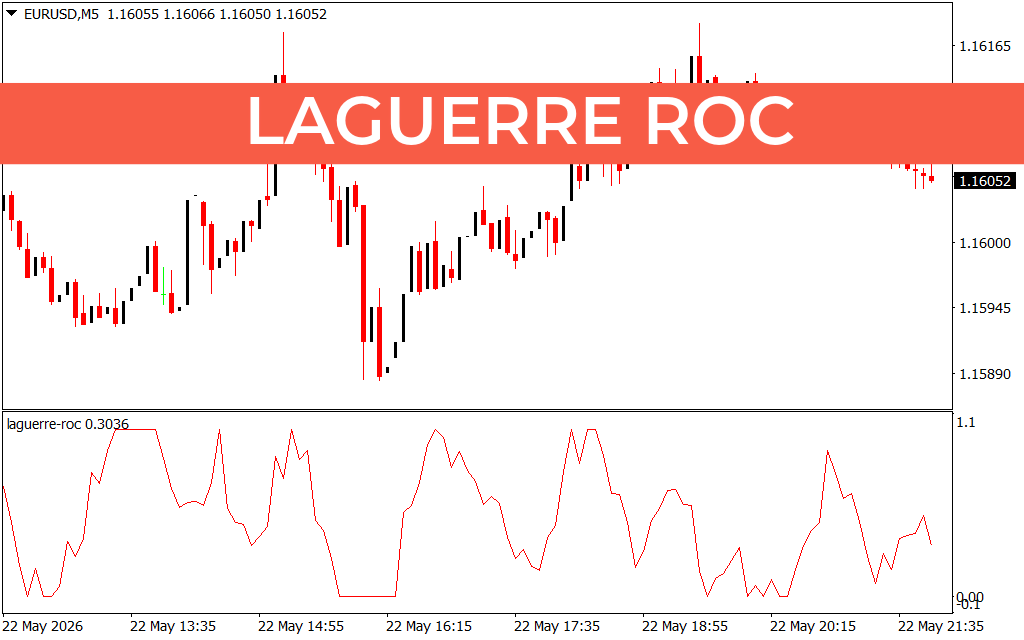
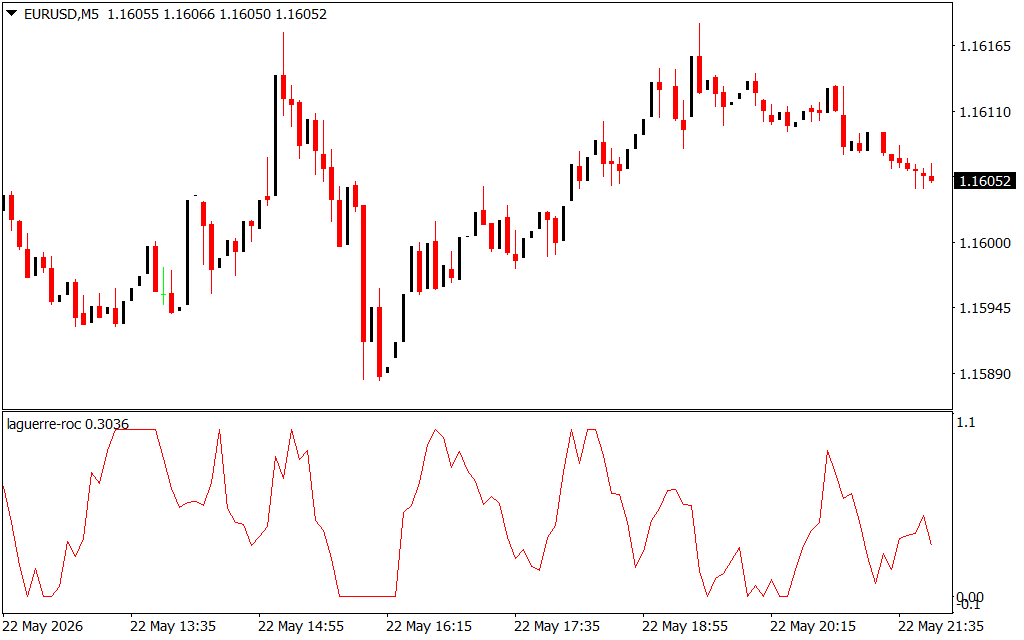
As displayed on the EURUSD 5-minute (M5) chart, the indicator transfers heavy mathematical data away from the main candle interface and places it inside a clean, dedicated sub-window pane. The laguerre-roc engine tracks market velocity by oscillating fluidly between a structural floor of $-0.1$ and an upper ceiling of $1.1$:
- The Upper Bounds ($1.1$ Plateaus): When the red line shoots up and flattens out at the absolute top of the indicator pane, it signals an extreme surge in bullish momentum. This indicates that buyers are aggressively driving a markup phase.
- The Lower Bounds ($-0.1$ Plateaus): When the line bottoms out at the absolute base of the pane, it confirms a dominant bearish markdown phase, highlighting intense selling velocity.
The sharp, reactive peaks and troughs between these boundaries map out intraday market waves perfectly. Instead of lagging behind the chart, the indicator catches the exact moment price transitions from an aggressive vertical run into a temporary period of distribution or consolidation.
Building a Unified Trading Strategy
The Laguerre ROC indicator is an exceptional tool for both trend-following and mean-reversion technical systems. For day traders and scalpers operating on short-term horizons like the M5 chart, it serves as a reliable confirmation engine.
When price reaches a key institutional supply or demand zone, you can watch the Laguerre ROC for early structural deceleration. A rapid decline away from the upper plateaus indicates that buying velocity is exhausting, giving you an objective, data-backed signal to lock in profits or look for short-term counter-trend reversals.
1 Download
Last Update:
May 24, 2026 02:09 AM
Published:
Jan 15, 2026 20:08 PM
Category: