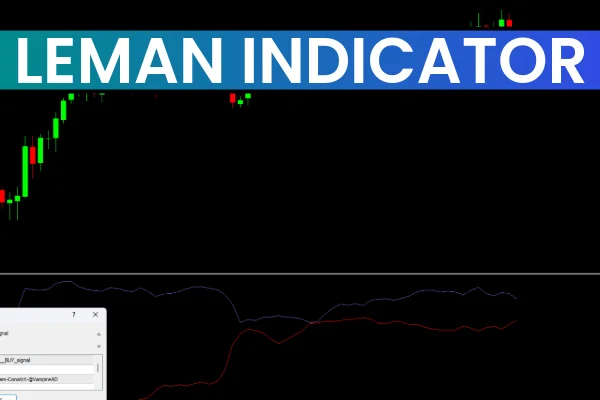
The LeMan Indicator MT4 is a trend-following oscillator developed to help traders detect bullish and bearish momentum with precision. Utilizing three adjustable smoothing levels and moving average crossovers, the indicator adapts to various market conditions, making it suitable for short-term and long-term strategies. Displayed in a separate chart window, it visualizes market energy using color-coded lines, offering clear signals for potential buy and sell opportunities.
How the LeMan Indicator MT4 Works
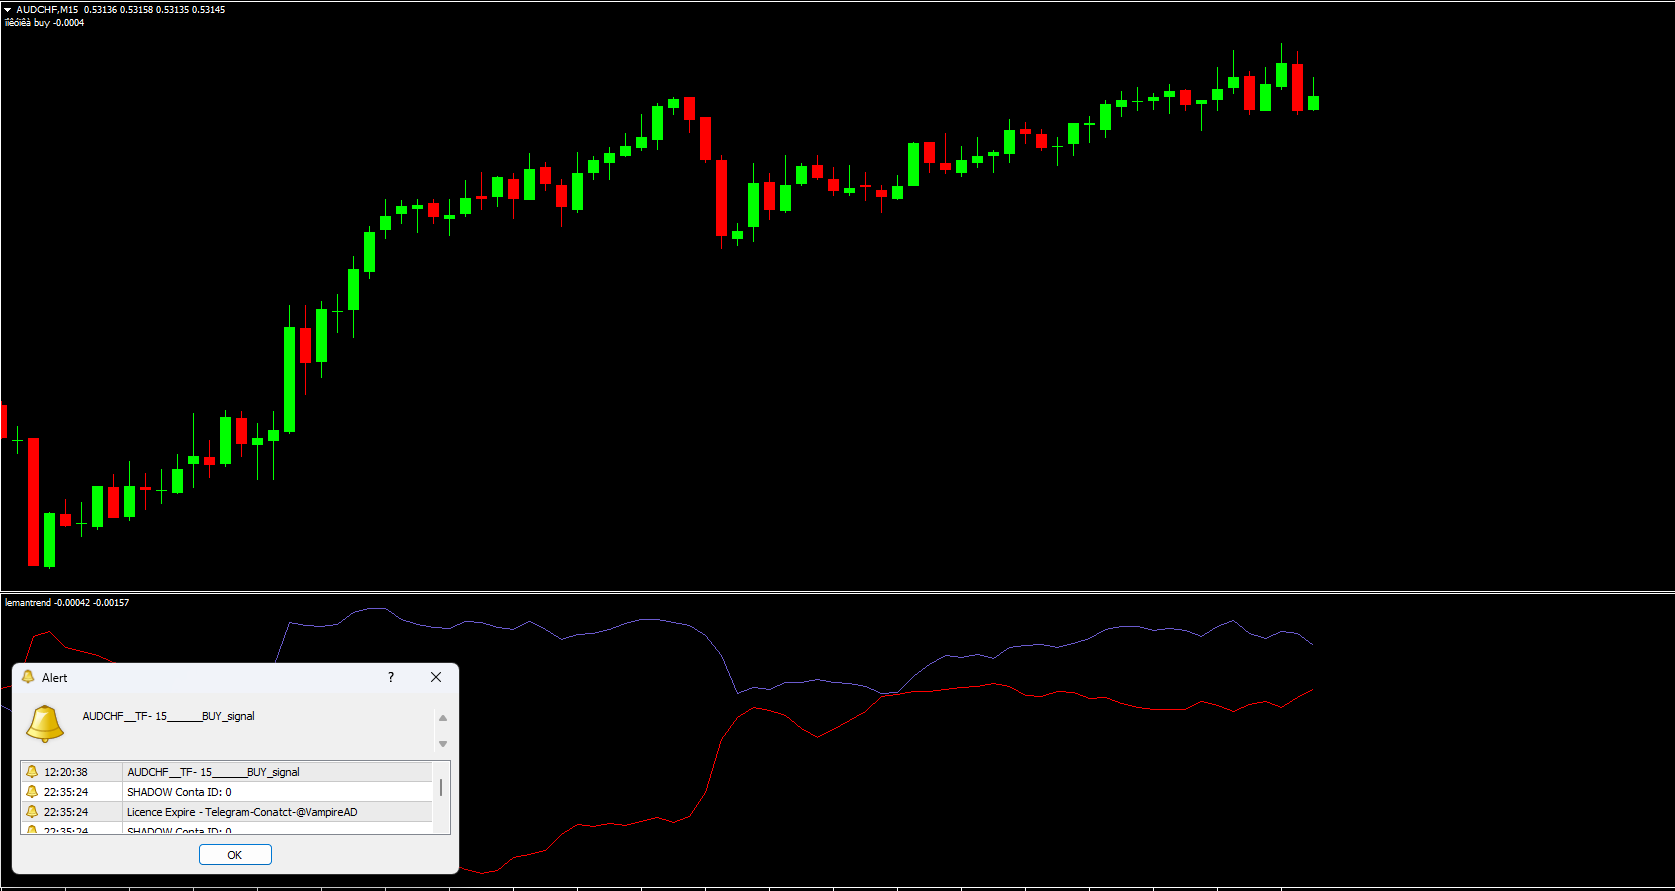
The indicator generates signals through the interaction of two smooth curves: a faster line (commonly red) and a slower line (typically blue). Key signal interpretations include:
Bullish Signal: When the faster red line crosses above the slower blue line from below, indicating a potential buy opportunity.
Bearish Signal: When the red line crosses below the blue line, suggesting a possible sell opportunity.
Trend Strength: The distance between the two lines from the zero level reflects the underlying trend momentum.
Color changes and the direction of line movement further confirm whether the momentum is strong or fading, providing additional clarity for trading decisions.
Key Features of the LeMan Indicator MT4
Dual-Line Crossover Mechanism
The crossover of the fast and slow lines provides timely alerts for trend reversals or continuation patterns, helping traders identify optimal entry and exit points.
Adjustable Smoothing Levels
Traders can customize the smoothing periods of the indicator to align with their preferred trading timeframe or strategy, offering flexibility for both Scalping and swing trading.
Clear Visual Signals
The indicator uses color-coded lines and a separate window to enhance visibility. This clarity ensures that trend signals are easy to interpret at a glance, reducing confusion during volatile market conditions.
Zero-Line Filter
The zero level can be used as a filter to confirm trend direction. Trades aligned with the zero line tend to have a higher probability of success.
How Traders Use the LeMan Indicator MT4
Traders commonly combine the LeManTrend Indicator MT4 with other technical tools like support and resistance levels, volume analysis, or RSI to improve the accuracy of their trades. Its dual-line system and visual alerts make it especially useful for:
Momentum Trading: Capturing short-term trend moves
Swing Trading: Identifying intermediate trend reversals
Risk Management: Confirming trend direction before entering trades
Benefits of Using the LeMan Indicator MT4
Timely alerts for potential reversals or trend continuations
Customizable smoothing for flexible trading strategies
High visual clarity with color-coded lines and easy-to-read signals
Enhances decision-making for multiple timeframes and trading styles
By integrating this indicator into your MT4 platform, you gain a reliable tool for trend analysis and momentum trading.
Conclusion
The LeManIndicator MT4 is an accessible and effective oscillator for traders seeking simple yet precise trend signals. Its dual-line crossover mechanism, combined with customizable smoothing settings and clear visual cues, ensures traders can spot potential reversals or trend continuations efficiently. This tool is ideal for enhancing momentum trading strategies across multiple timeframes.
For more advanced MT4 indicators and trading resources, visit IndicatorForest.com.
FAQ
The LeMan Indicator MT4 is a trend-following oscillator that detects bullish and bearish momentum with precision using three adjustable smoothing levels and moving average crossovers. It visualizes market energy using color-coded lines displayed in a separate chart window, offering clear signals for potential buy and sell opportunities.
A bullish signal occurs when the faster red line crosses above the slower blue line from below, indicating a potential buy opportunity. A bearish signal occurs when the red line crosses below the blue line, suggesting a possible sell opportunity. The distance between the two lines from the zero level reflects the underlying trend momentum.
The zero level can be used as a filter to confirm trend direction. Trades aligned with the zero line tend to have a higher probability of success. Color changes and the direction of line movement further confirm whether the momentum is strong or fading, providing additional clarity for trading decisions.
Traders commonly combine the LeMan Indicator with other technical tools like support and resistance levels, volume analysis, or RSI to improve the accuracy of their trades. Its dual-line system and visual alerts make it especially useful for momentum trading, swing trading, and risk management by confirming trend direction before entering trades.
Yes, traders can customize the smoothing periods of the indicator to align with their preferred trading timeframe or strategy, offering flexibility for both scalping and swing trading. The adjustable smoothing levels allow adaptation to various market conditions, making it suitable for short-term and long-term strategies.
1 Download
Published:
Dec 15, 2025 00:59 AM
Category: