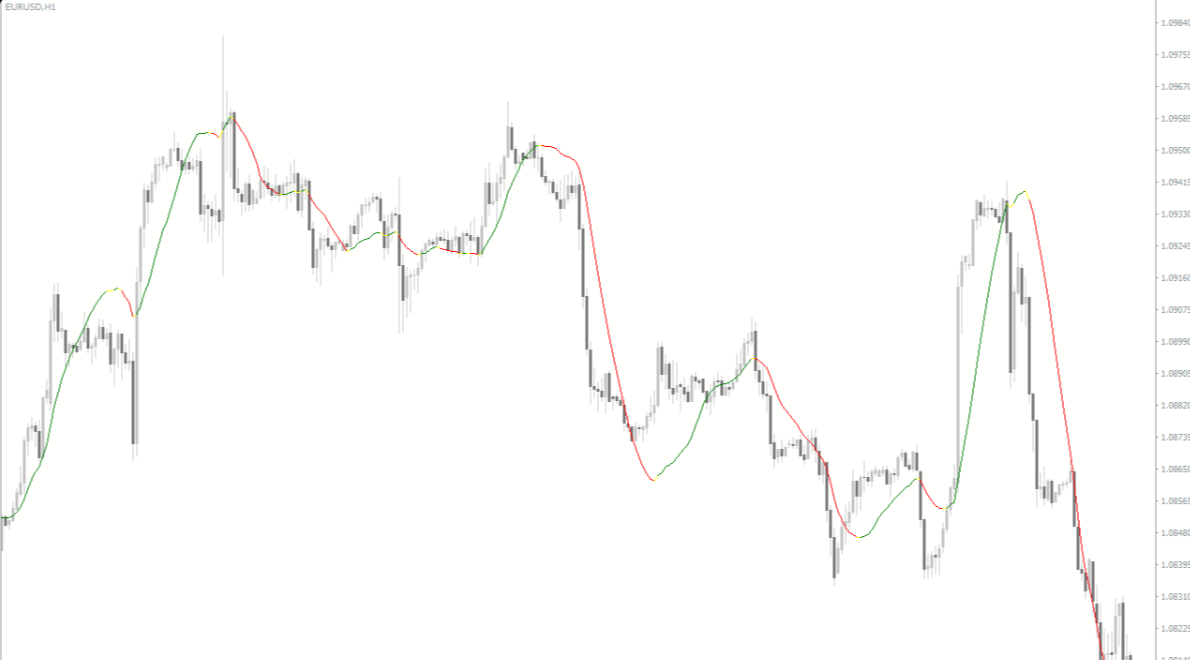
The Linear Regression Indicator is a widely used and practical forex tool designed for the MetaTrader 4 (MT4) platform. This free indicator helps traders identify market trends by plotting a straight regression line based on historical prices. By calculating the slope of this line, traders can determine the direction of the market and spot potential entry and exit points.
The Linear Regression Indicator MT4 is particularly useful when combined with other technical analysis tools, as it helps confirm trade signals and enhance trading decisions.
How the Linear Regression Indicator Works
The indicator uses past price data to calculate a linear regression line, which represents the general direction of the market over a selected period.
Slope Analysis
Upward Slope: Indicates a bullish trend
Downward Slope: Indicates a bearish trend
Flat Slope: Suggests ranging or sideways market
Price Deviation Signals
When the price moves significantly above the regression line, it may signal overbought conditions or potential reversal
When the price moves below the line, it may indicate oversold conditions or buying opportunities
This combination of trend direction and price deviation helps traders identify potential trade setups.
Key Features of Linear Regression Indicator
Trend Identification
The indicator provides a clear visual of market trends, helping traders follow the direction of the trend accurately.
Entry and Exit Signals
By observing price deviations from the regression line, traders can make better-timed entries and exits.
Multi-Timeframe Compatibility
The indicator works effectively across all MT4 timeframes, suitable for:
Day trading
Swing trading
Easy Installation and Customization
Traders can add the Linear Regression Indicator to their MT4 charts and adjust parameters to fit their preferred trading style.
How to Trade Using Linear Regression Indicator
Trend Following Strategy
Buy when the price is above a positively sloped regression line and shows upward momentum
Sell when the price is below a negatively sloped regression line and shows downward momentum
Reversal Strategy
Monitor for extreme price deviations from the regression line
Combine with support/resistance levels or oscillators for confirmation
Risk Management
Always implement stop-loss and take-profit orders. While the Linear Regression Indicator MT4 provides useful trend insights, proper risk control is essential.
Advantages of Linear Regression Indicator
Free to download and use
Clearly visualizes market trends and direction
Identifies potential entry and exit points
Works on all MT4 timeframes
Suitable for both beginner and experienced traders
These features make the Linear Regression Indicator a practical tool for improving trading accuracy and decision-making.
Who Should Use This Indicator
The Linear Regression Indicator MT4 is ideal for:
Traders seeking trend confirmation
Analysts using statistical tools for trading
Beginners learning market trend concepts
Experienced traders enhancing trade precision
Its combination of trend detection and deviation signals makes it highly versatile for various trading styles.
Final Thoughts
The Linear Regression Indicator MT4 is an effective and easy-to-use forex tool that helps traders analyze market trends and make better trading decisions. By combining trend direction with price deviation analysis, traders can identify high-probability trade setups and optimize their trading strategy.
👉 Visit IndicatorForest.com to download the Linear Regression Indicator MT4 and explore more professional forex indicators to improve your trading performance.
FAQ
The Linear Regression Indicator plots a straight line that best fits recent price data, representing the average direction of the market over that period. Its slope reveals whether the market is trending up, down or moving sideways.
When price moves far above the regression line, it may indicate temporary overbought conditions, while sharp moves far below can suggest oversold conditions. Traders often look for signs of exhaustion or reversal around these extremes, especially near major support or resistance.
It can support both. Trend followers watch the slope and trade in the line’s direction, while mean‑reversion traders look for price snapping back toward the line after large deviations. Your money‑management rules should reflect which style you choose.
The indicator works on any MT4 timeframe, but higher timeframes like H4 or Daily usually provide cleaner, more stable regression lines. Lower timeframes react faster but can change slope frequently in choppy markets.
Use the regression line to define trend bias, then combine it with oscillators, support and resistance or candlestick patterns for timing. For example, look for pullbacks toward the line within an uptrend and enter when momentum turns back in the trend direction.
Published:
Dec 18, 2025 03:45 AM
Category: