Trading the Flanks: Mastering Structural Breakouts with the Linear Regression Channel Breakout MT4 Indicator
In the highly competitive world of forex trading, accuracy in identifying the core market path is what separates profitable day traders from the rest. While standard trendlines are highly subjective and prone to human error, mathematical models offer an un-biased alternative. The Linear Regression Channel Breakout MT4 Indicator utilizes advanced statistical calculations to plot an equilibrium median line flanked by upper and lower standard deviation boundaries. This creates a dynamic, self-adjusting channel that reveals exactly where price is overextended and when an explosive structural breakout is underway.
Dissecting the Regression Structure on EUR/USD M5
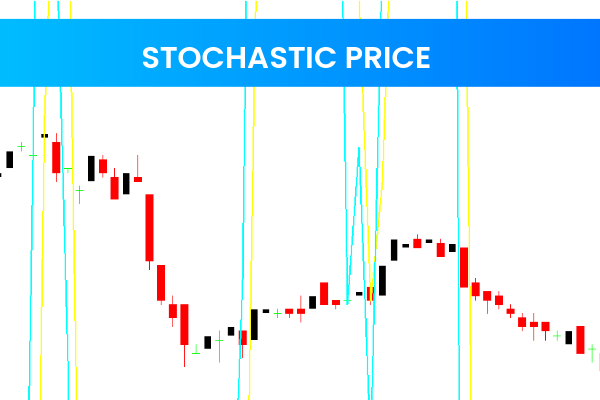
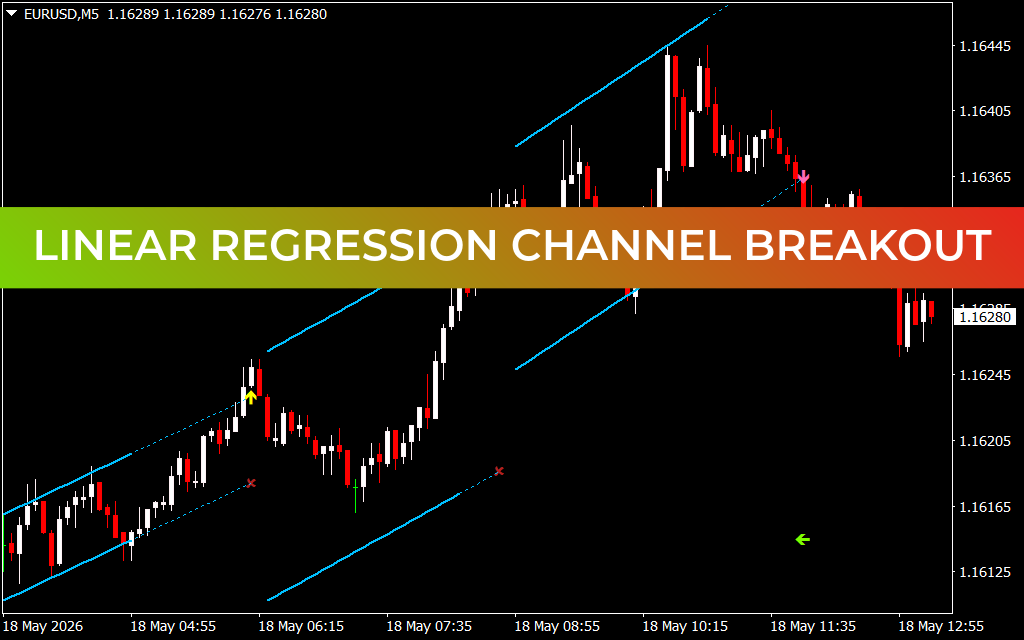
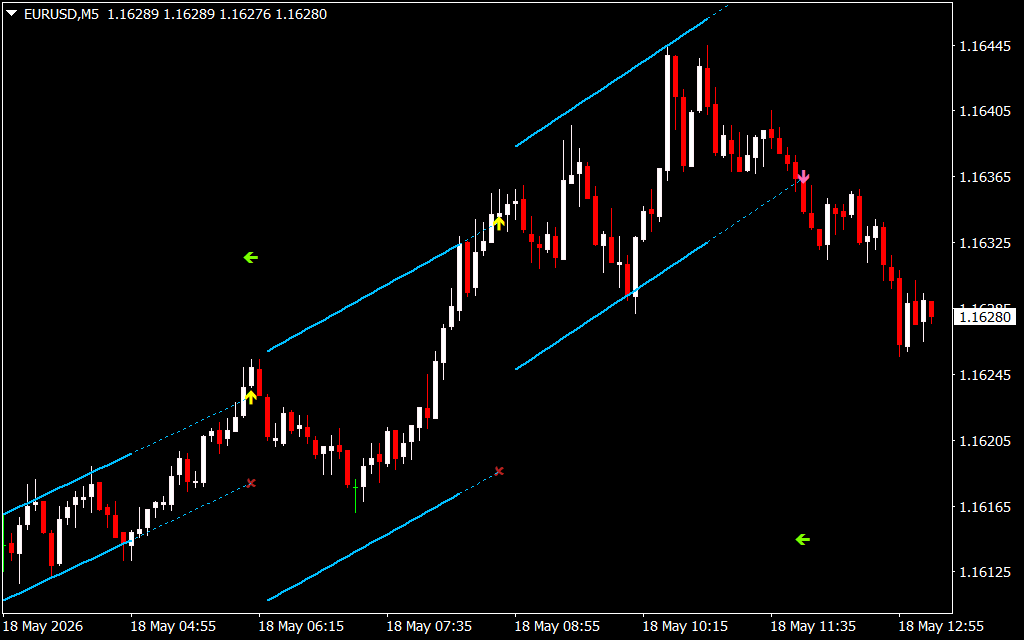
The attached EUR/USD 5-minute (M5) chart perfectly illustrates how this indicator maps institutional order flow during a shifting intra-day session. The linear regression channel uses solid and dashed light blue parallel lines to define the fair value area of the prevailing trend.
Early in the May 18 session, the indicator calculated a clear upward-sloping trajectory, anchored near the 1.16125 liquidity pool. As long as Price Action oscillates within these boundaries, the market is considered to be in a balanced state. For a short-term scalper, the lower parallel channel line serves as a highly reliable, low-risk buying zone.
Notice how the price continuously bounced off this lower boundary, printing higher lows as it advanced. The indicator enhances execution by printing yellow directional arrows when the price tests these extreme outer bands, signaling a high-probability mean-reversion or continuation opportunity.
Capitalizing on Channel Breakouts and Trend Rotations
While trading inside the channel provides consistent compounding opportunities, the most lucrative moves occur during a true structural breakout. The Linear Regression Channel Breakout Indicator is engineered to highlight exactly when price action deviates from statistical norms.
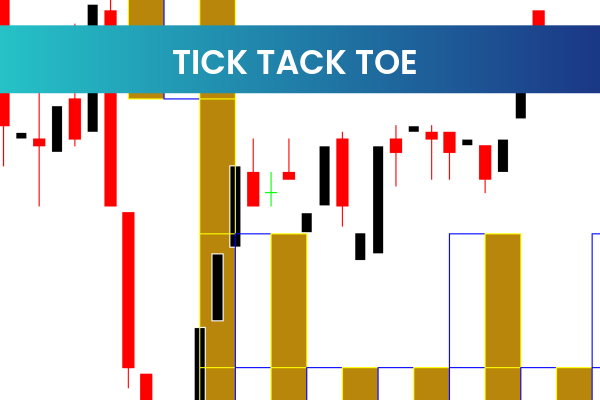
During the mid-morning acceleration phase, the EUR/USD pair experienced an aggressive volume injection, causing the price to surge violently past the 1.16325 level. This explosive momentum pushed the candlesticks entirely outside the upper channel boundary, peaking near 1.16445. In technical analysis, a sustained close outside a linear regression channel indicates a structural breakout, warning traders that the previous trend is reaching a climax.
Following this overextension, the Market Structure shifted into a distribution phase. The indicator adapted in real time, signaling a trend rotation as the price breached the lower dashed support line, marked by a purple exit arrow near 1.16365. The pair subsequently embarked on a sharp markdown phase toward the current price of 1.16280.
By integrating the Linear Regression Channel Breakout MT4 indicator into your daily analysis, you remove the guesswork from trend tracking. It equips you with precise mathematical boundaries to buy the dips in a healthy trend, trail your stop-losses beneath structural pivots, and confidently exploit massive breakout momentum when the market expands.
7 Downloads
Last Update:
May 18, 2026 16:19 PM
Published:
Jan 20, 2026 13:12 PM
Category: