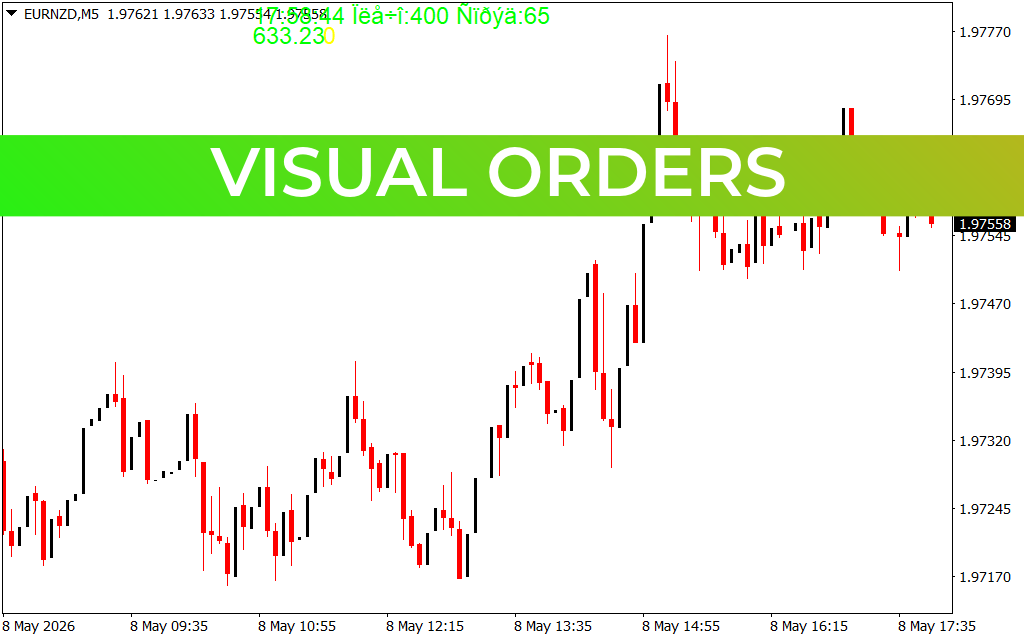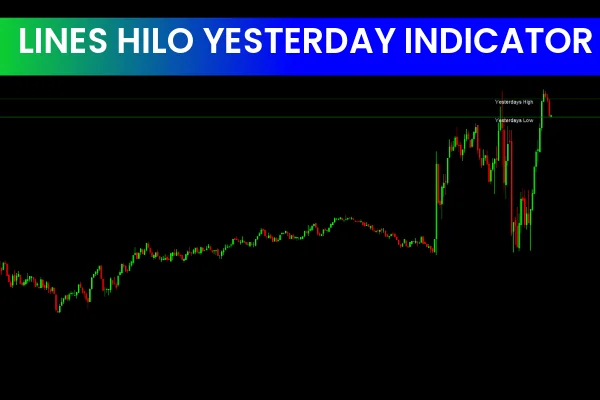
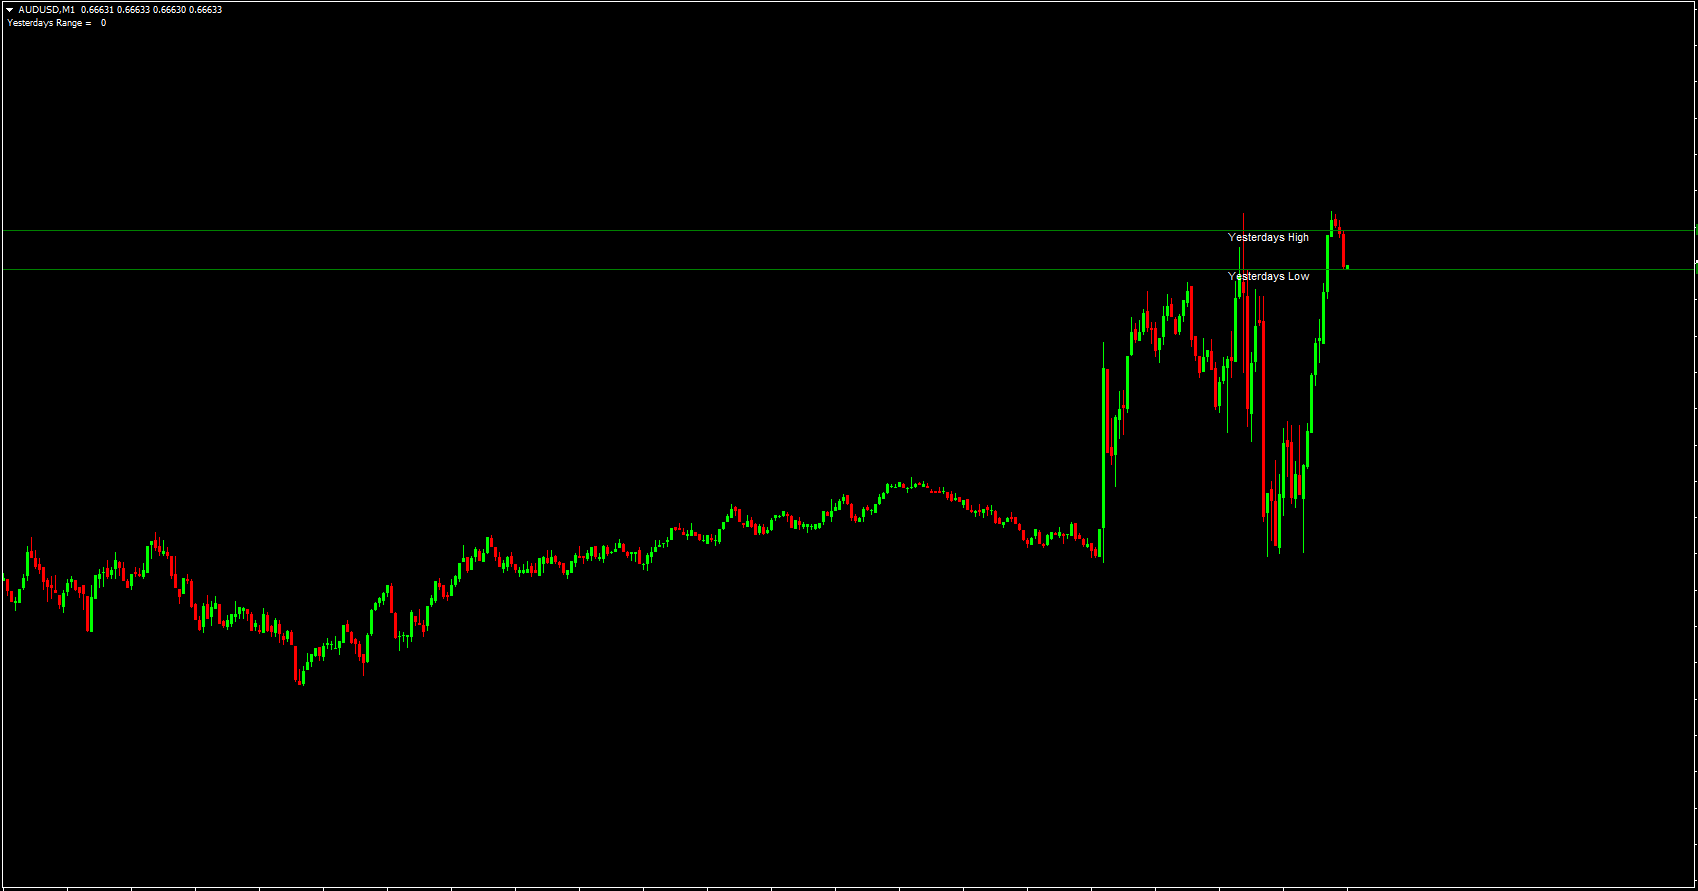
The Lines HiLo Yesterday Indicator for MT4 plots two key price levels from the previous trading day: the high and the low. These historical levels often act as natural Support And Resistance zones, making them extremely valuable for analyzing market structure. Traders use these reference points to plan breakout, reversal, and breakout-failure strategies across forex, commodities, indices, and crypto markets. Because the indicator is simple, clean, and highly visual, it is equally effective for beginners and advanced traders.
How the Indicator Works
The indicator places one horizontal line at yesterday’s high and another at yesterday’s low. While it works on any timeframe—M1, M5, H1, H4, and more—the values always come from the daily candle, meaning they remain fixed for the entire day. This stability provides a powerful framework for intraday traders who rely on predictable reference points.
Why Yesterday’s High and Low Matter
Yesterday’s high acts as a resistance level, and yesterday’s low acts as a support level. Markets often react to these levels because they represent areas where supply or demand was strong enough to halt price movement the previous day.
Key Advantages
Offers accurate and stable support/resistance levels
Helps identify breakout opportunities
Provides clear structure for trend traders and range traders
Works on all timeframes
Suitable for manual or automated trading systems
Ideal for both beginners and advanced traders
Trading Strategies Using the Lines HiLo Yesterday Indicator
Breakout Strategy
A breakout occurs when price moves beyond yesterday’s levels with momentum.
Buy Trade Setup
Trigger: Price breaks above yesterday’s high
Stop Loss: Below the latest swing low
Take Profit: Based on your risk-reward plan (1:2, 1:3, or trailing stop)
When the previous day’s high is broken, it often indicates bullish continuation.
Breakout Failure
If price briefly breaks the high but quickly reverses, it signals a potential false breakout. Traders often use bearish candlestick patterns (pin bars, engulfing candles) to confirm reversal entries.
Sell Trade Setup
Trigger: Price breaks below yesterday’s low
Stop Loss: Above the most recent swing high
Take Profit: Based on your strategy or using Price Action targets
Breaking the previous low signals bearish sentiment and often leads to extended downward moves.
Combining Lines HiLo Yesterday Indicator With Other Tools
While the indicator is powerful on its own, combining it with other tools improves accuracy.
Recommended Combinations
Moving Averages: For identifying trend direction
MACD: For confirming momentum shifts
RSI: For spotting overbought or oversold reversals
Volume Indicators: To confirm breakout strength
These combinations reduce false signals and improve trade timing.
Practical Tips for Best Use
Avoid trading immediately during high-volatility news
Wait for candle closings to confirm true breakouts
Use multiple timeframe confluence (H1 + H4 + Daily)
Do not trade every touch—look for strong confirmation signals
Integrate risk management in every strategy
Conclusion
The Lines HiLo Yesterday Indicator for MT4 is an essential tool for traders who want a clear understanding of support and resistance derived from daily market structure. Whether you trade breakouts, reversals, or Trend Continuation setups, these levels offer reliable guidance.
To explore more premium indicators and trading tools, visit IndicatorForest.com and upgrade your trading strategy today.
FAQ
1 Download
Published:
Dec 10, 2025 15:06 PM
Category: