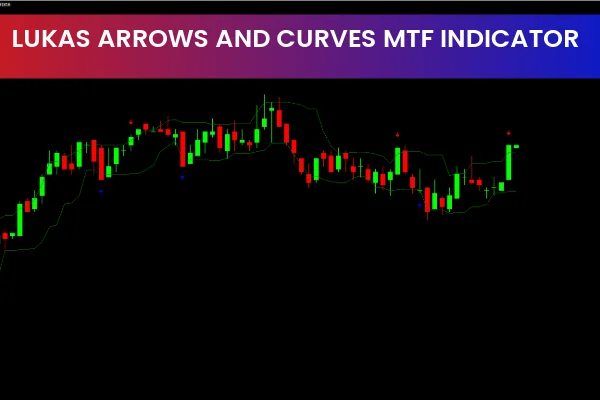
The Lukas Arrows and Curves MTF Indicator is a popular and highly effective forex trading tool designed for the MetaTrader 4 (MT4) platform. It is free to download and easy to use, making it suitable for both beginner and experienced traders.
This indicator helps traders identify market trends by displaying a combination of arrows and curved bands that signal trend reversals or trend continuations. Additionally, it provides valuable insights into the strength and direction of the current trend.
How the Lukas Arrows and Curves MTF Indicator Works
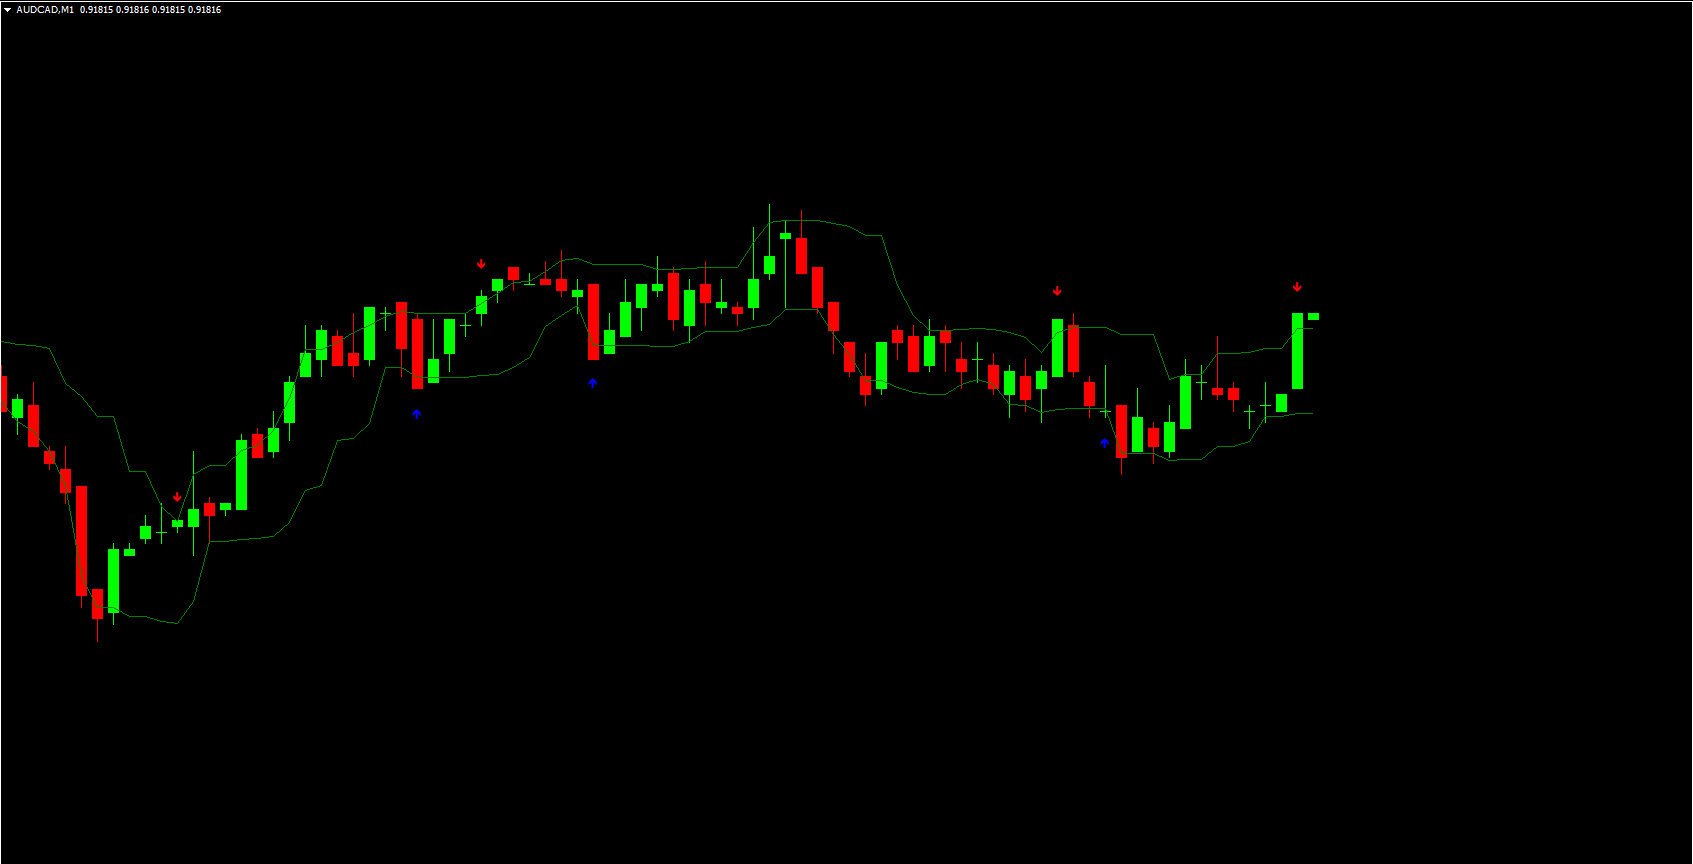
The indicator plots upper and lower curved bands along with colored arrows on the chart:
Blue Arrow (Buy Signal) → Indicates potential upward price movement
Red Arrow (Sell Signal) → Indicates potential downward price movement
Curved Bands → Help identify trend direction, volatility, and dynamic support/resistance
Because the indicator is multi-timeframe (MTF), traders can analyze signals from higher timeframes while staying on their preferred chart.
How to Use the Lukas Arrows and Curves MTF Indicator
You can apply the indicator in several practical ways:
Identifying Entry and Exit Points
Buy Entry:
When price touches the lower band,
A blue arrow appears.
Place the stop-loss below the previous swing low.
Sell Entry:
When price touches the upper band,
A red arrow appears.
Place the stop-loss above the previous swing high.
Spotting Support and Resistance
The curved bands act as dynamic Support And Resistance, helping determine where the price may react or reverse.
Detecting Breakouts and Reversals
The indicator can highlight:
Possible breakout zones
Trend Continuation areas
Early reversal points
Areas where price may accelerate or exhaust momentum
Because signals are visually intuitive, traders can use it standalone or combine it with:
RSI
Moving Averages
MACD
Volume indicators
Conclusion
The Lukas Arrows and Curves MTF Indicator is a powerful addition to any trader’s toolkit. Its clear visual signals make entering and exiting trades easier and more objective. Whether you are following trends, looking for reversals, or analyzing support/resistance levels, this indicator provides dependable guidance.
FAQ
12 Downloads
Published:
Dec 08, 2025 01:40 AM
Category: