Simplifying Multi-Timeframe Trends with the Ma 4H Cross Indicator
In the Forex markets, trading with the higher-timeframe trend is one of the most reliable ways to increase your win rate. However, continuously switching back and forth between short-term execution charts and macro trend charts often leads to hesitation and missed opportunities. The Ma 4H Cross indicator solves this dilemma by bringing the power of institutional 4-hour (H4) moving average data directly onto your lower-timeframe workspaces, creating a seamless multi-timeframe trading system.
The Power of H4 Moving Averages on Lower Timeframes
The 4-hour timeframe is widely regarded as a benchmark for institutional market participants. Banks, hedge funds, and algorithmic systems closely monitor H4 moving averages to establish their core directional bias for the day or week.
When you trade on intraday scales—such as the 15-minute (M15) chart—it is easy to mistake a minor, short-term price spike for a major structural reversal. The Ma 4H Cross indicator filters out this marketplace noise. By calculating and plotting 4-hour moving average lines dynamically across lower timeframes, it ensures you always know exactly which way the macroeconomic tide is flowing.
Analyzing the Visual Framework
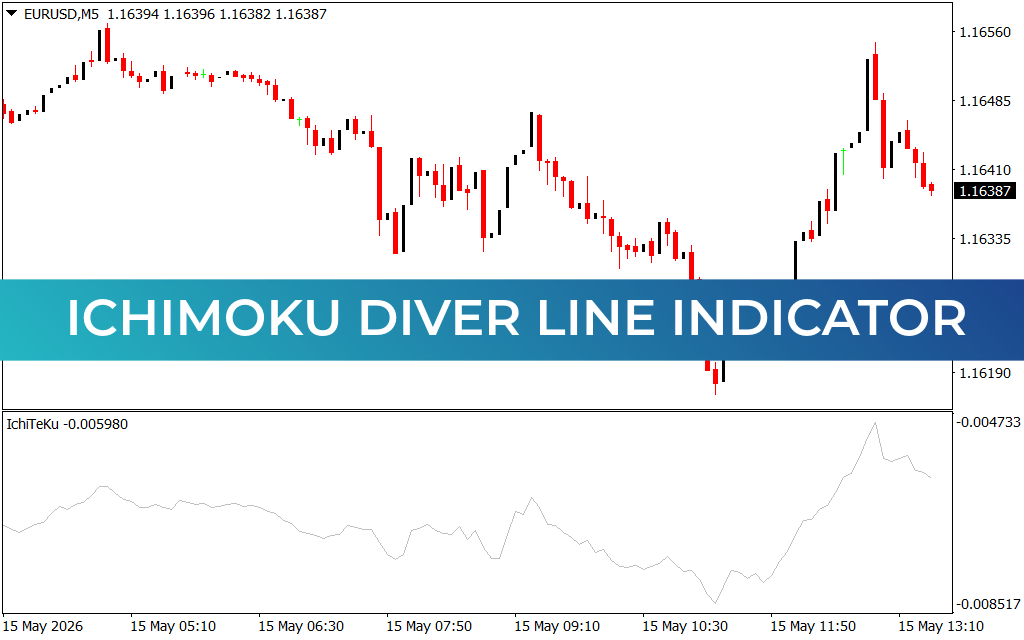
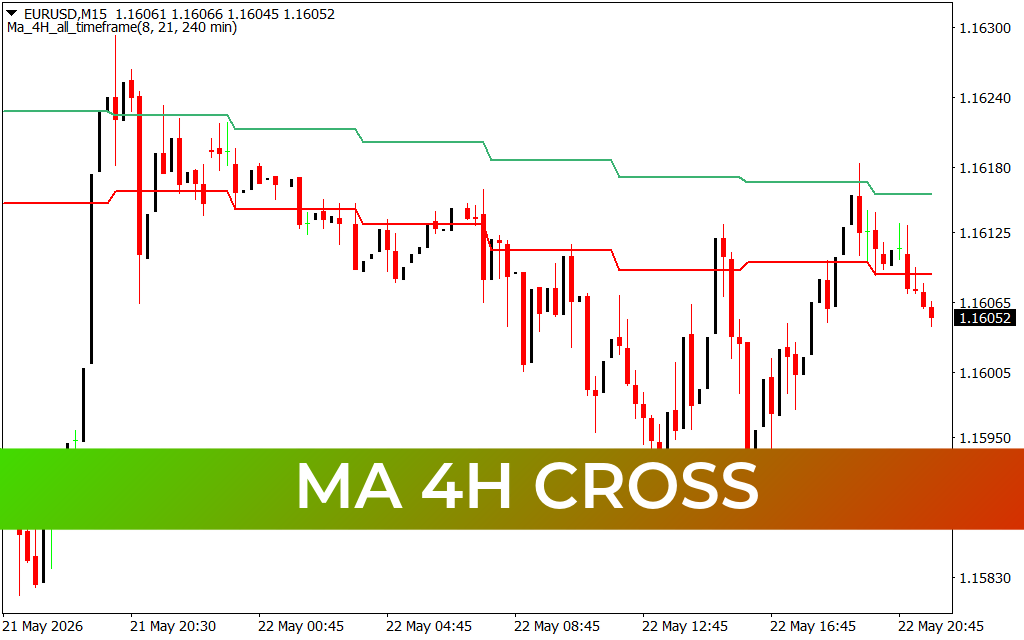
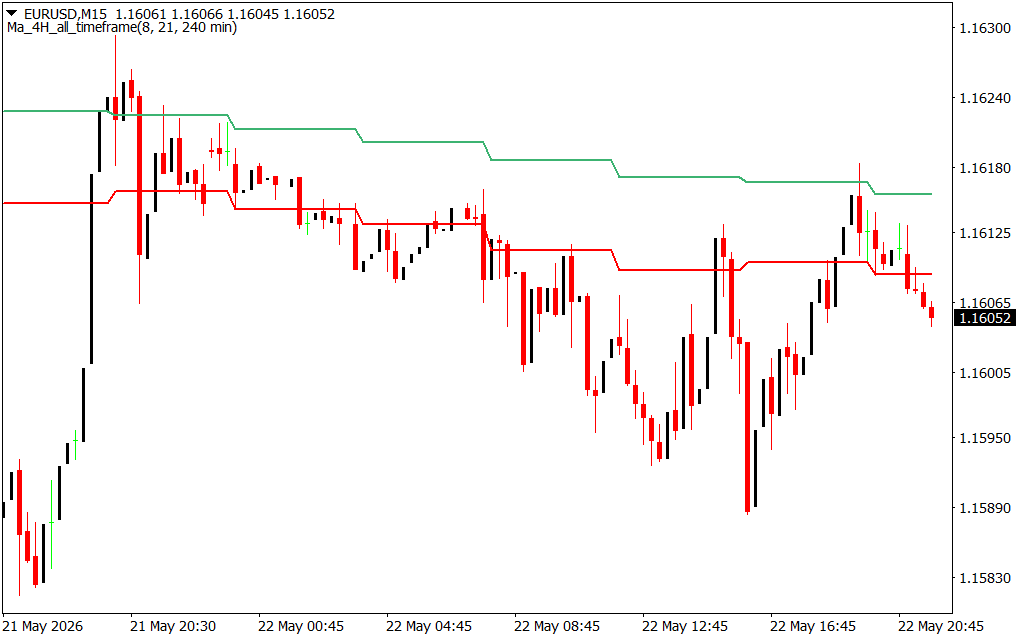
As displayed on the EURUSD M15 chart, the indicator plots two distinct, stepped horizontal lines that act as dynamic institutional Support And Resistance zones:
- The Upper Green Line: Represents the higher-period baseline tracking the dominant bearish or bullish boundaries from the 4-hour perspective.
- The Lower Red Line: Acts as the fast tracking component of the 4-hour moving average structure.
Because these lines represent data from a much higher timeframe ($240\text{ minutes}$), they print as clean, stepped horizontal lines rather than smooth curves. This stepped layout is highly advantageous. It shows you the exact price levels where the 4-hour moving averages settled during previous blocks of time, giving you fixed, unmoving price barriers to reference when calculating your risk-to-reward ratios.
Executing a Mechanical Multi-Timeframe Strategy
The Ma 4H Cross serves as a highly robust trend filter for day traders and scalpers. As seen in the attached chart, when Price Action breaks below the red line and stays capped beneath the green line, the market is in a confirmed macro markdown phase.
- Trend Following: During a bearish alignment, traders should strictly look for short setups when price pullbacks up to test the red or green lines as overhead resistance.
- Risk Management: The stepped lines offer logical locations for protective stop-losses. Placing a stop just above the green line protects your capital behind an institutional-grade firewall.
By integrating this tool into your trading routine, you remove the emotional guesswork from trend identification. You can execute short-term setups wit
5 Downloads
Last Update:
May 24, 2026 02:00 AM
Published:
Jan 15, 2026 20:24 PM
Category: