Simplifying Trend Detection: The MA Histogram Indicator Explained
Moving averages are the foundational bedrock of technical analysis, helping traders smooth out erratic Price Action to identify the underlying market direction. However, conventional moving average lines plotted directly on a price chart can sometimes lead to visual clutter or delayed reactions during fast-moving market shifts. The MA Histogram Indicator reimagines this classic tool, overlaying an intuitive, color-coded vertical histogram directly onto your price candles to give you real-time momentum visualization.
Here is an analysis of how this indicator improves on traditional moving averages and how you can use it to pinpoint high-probability trading entries.
Redefining Momentum with an On-Chart Histogram
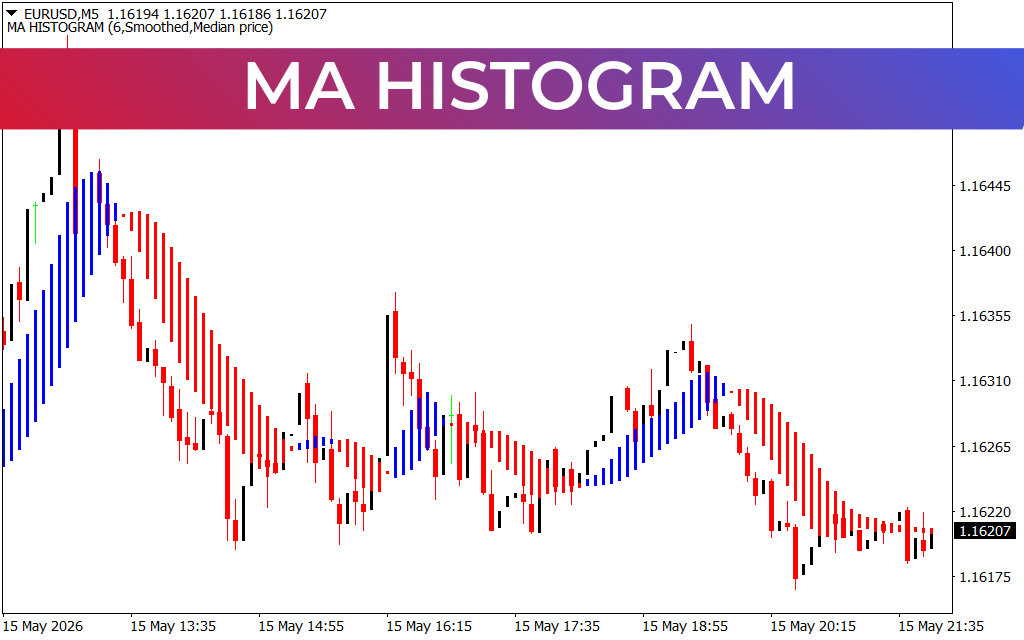
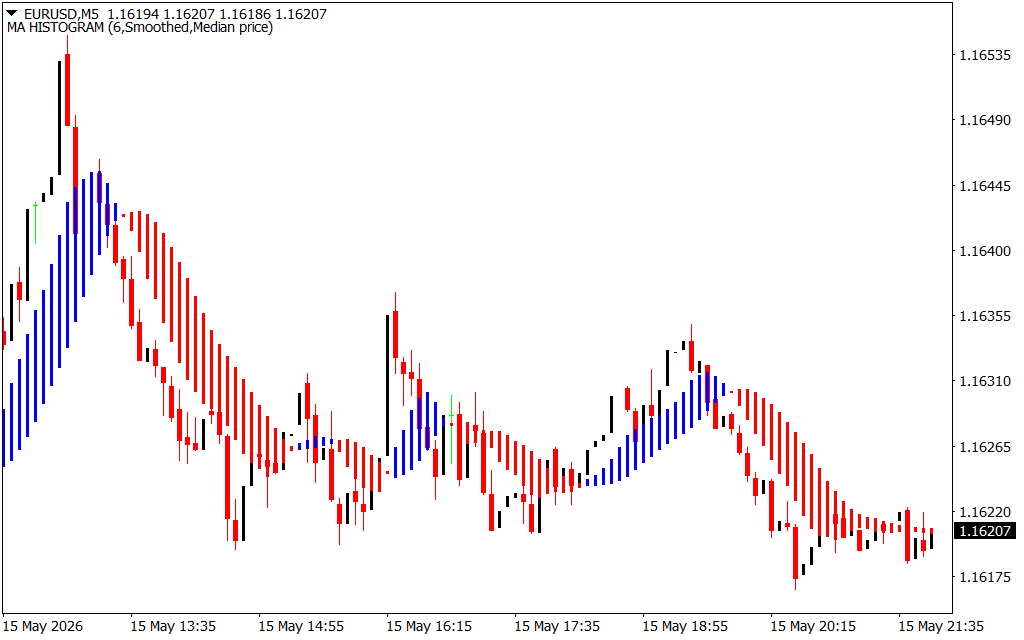
Unlike traditional moving averages that present as a single, continuous line threading through the candles, the MA Histogram calculates the relationship between price data and a specific moving average mathematically (in this case, a 6-period, Smoothed moving average based on the Median price). It then displays this data as dynamic, vertical bars mapped over each candle.
By converting a simple line into a structural histogram, the indicator makes changes in momentum instantly scannable. Instead of waiting for a price candle to clearly break away from a line, the changing length and color of the histogram bars give you an immediate health check on the strength, speed, and sustainability of the current intraday trend.
Decoding the Color Signals on the Chart
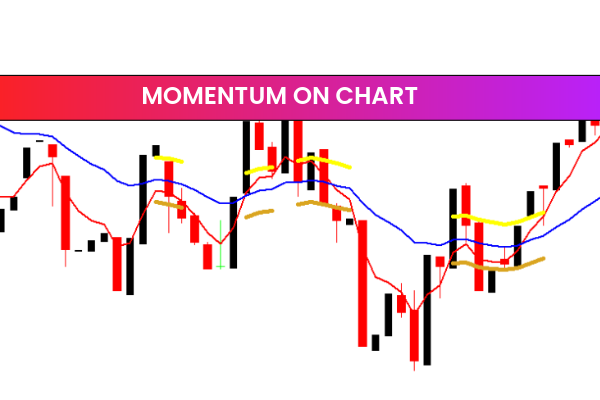
As illustrated on the EUR/USD M5 chart, the indicator strips away the guesswork by breaking trend conditions down into two highly distinct visual phases:
- The Bullish Momentum Phase (Blue Bars): When the histogram bars turn bright blue, it signals that the buyers are in control and upward momentum is accelerating. The height of the bars tracks how aggressively price is pulling away from its baseline average.
- The Bearish Momentum Phase (Red Bars): When the histogram shifts to solid red, it alerts you that downward pressure has taken over. This visual cue serves as an immediate warning to stop looking for buy entries and start focusing on short opportunities.
When the bars begin shrinking in size, it acts as an early warning system that the current micro-trend is losing steam, long before a formal moving average crossover or Trend Reversal occurs on your chart.
Strategic Applications for Day Trading
To extract maximum value from the MA Histogram, consider incorporating these structural trading practices into your strategy:
- Precision Entry Confirmation: Use the indicator as a momentum filter. If you are using a secondary trading system that flashes a buy signal, ensure that the MA Histogram has turned blue on the 5-minute chart to confirm that active order flow is backing up your trade.
- Early Target Scaling: If you are riding a short trade during a dominant red phase and notice the red bars rapidly contracting toward zero, it is an ideal technical indicator to scale out of a portion of your position or trail your stop-loss tighter to lock in profit.
- Filtering Market Chops: During horizontal consolidations, the histogram bars will quickly alternate between red and blue while remaining exceptionally short. This visual flatline tells you to stay on the sidelines until an expansive breakout generates long, sustained bars once again.
4 Downloads
Last Update:
May 17, 2026 01:40 AM
Published:
Jan 21, 2026 01:24 AM
Category: