Maximize Trend Precision with the MA Histogram Separate Window Indicator
In the fast-paced world of Forex trading, chasing market noise is one of the quickest ways to deplete a trading account. Day traders and scalpers frequently struggle to distinguish a minor price retracement from an actual, structural Trend Reversal. To solve this dilemma, smart technical analysis relies on clear, visual volume and momentum metrics. The MA Histogram Separate Window indicator provides exactly that by taking core moving average mechanics and translating them into a highly intuitive, color-coded momentum workspace.
By isolating trend direction below your main price charts, this indicator allows traders to maintain a clean workspace while executing objective, rule-based strategies.
The Power of Sub-Window Trend Isolation
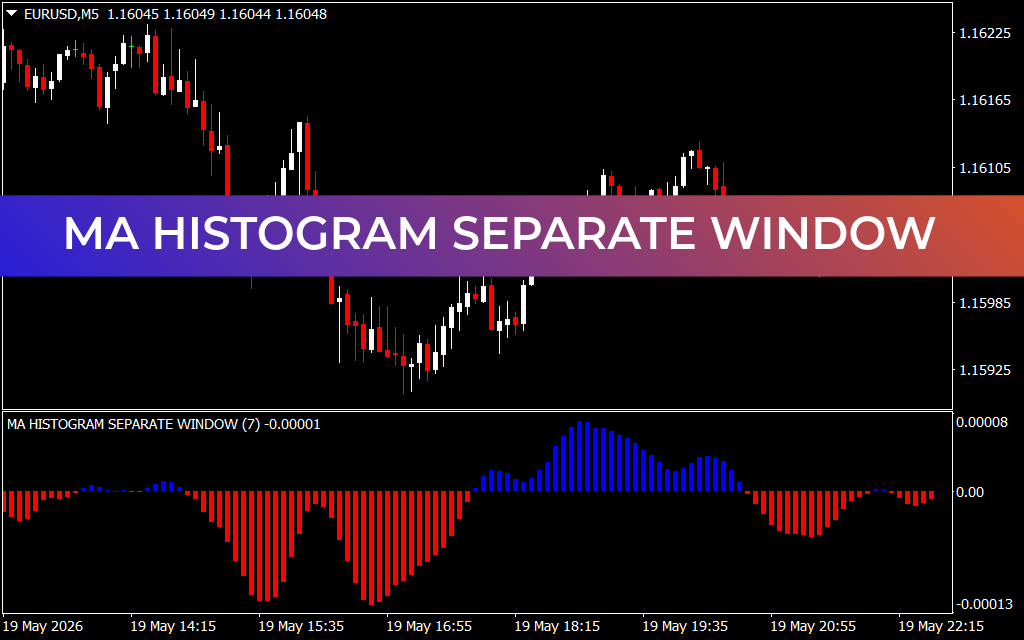
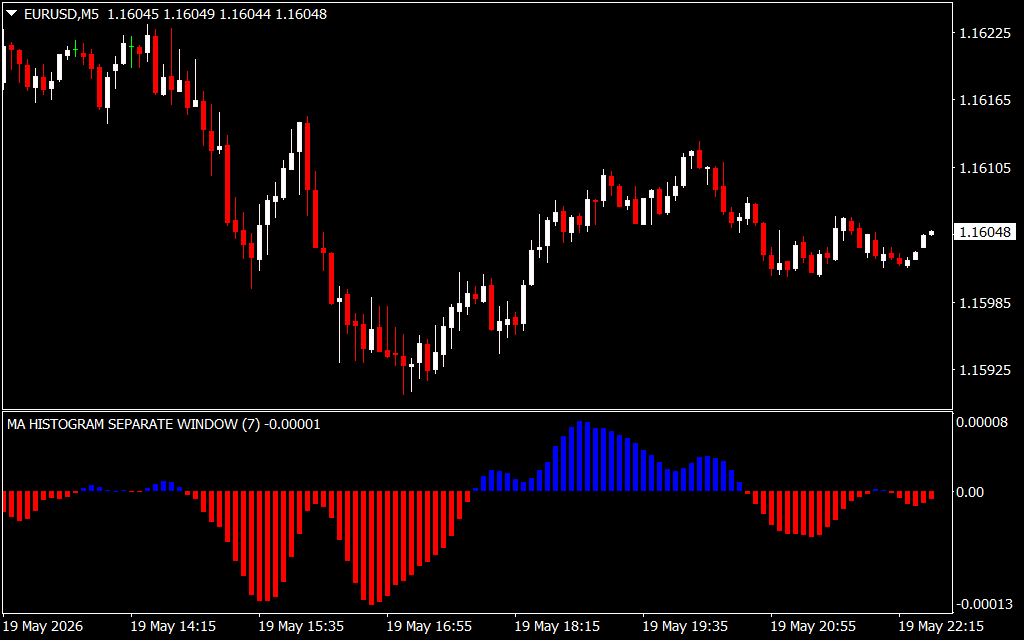
When tracking quick market shifts on the 5-minute ($M5$) chart, cluttering your primary candlesticks with multiple moving average lines can obscure important Price Action cues like pin bars or engulfing patterns. The MA Histogram Separate Window indicator keeps your workspace pristine by operating entirely within a dedicated sub-window.
As seen in real-time configurations like the MA HISTOGRAM SEPARATE WINDOW (7), the software evaluates localized price velocities and breaks market sentiment down into clear, undeniable visual blocks:
- Dominant Bullish Momentum (Blue Bars): When the underlying moving average calculations confirm that buyers are securely in control, the histogram prints bright blue bars above the 0.00 baseline. This serves as an immediate visual green light for long setups and trend-continuation strategies.
- Dominant Bearish Momentum (Red Bars): Conversely, when distribution accelerates and sellers drive the Market Structure downward, the histogram shifts beneath the zero axis, painting red bars. This warns traders to halt buy orders and focus strictly on short positions.
Executing Low-Risk Strategies with Mathematical Confluence
The real edge provided by the MA Histogram Separate Window tool lies in its ability to pinpoint momentum exhaustion and transition phases before they become obvious on the main chart.
1. Catching Early Reversals via Zero-Line Crossings
The absolute zero line (0.00) acts as the ultimate psychological boundary between bulls and bears. When a sequence of deep red bars begins to contract upward and successfully crosses above the zero baseline into a blue bar, it confirms a definitive shift in market equilibrium—giving scalpers an incredibly early entry into emerging bullish legs.
2. Trading the Pullback (Trend Continuation)
During an aggressive macro trend, price will naturally pull back, causing the histogram bars to temporarily shrink toward the zero axis. If the histogram color remains steady (e.g., staying red during a downtrend without crossing the zero line) and then expands outward again, it signals a high-probability pullback rejection. This gives you a low-risk opportunity to re-enter the trend alongside institutional volume.
Conclusion
The MA Histogram Separate Window indicator simplifies Trend Following by removing human emotion from the equation. Its clear dual-color system alerts you to critical momentum shifts instantly, helping you stay on the right side of the market across any timeframe. Download it today to elevate your technical framework and trade with systematic clarity.
2 Downloads
Last Update:
May 20, 2026 01:40 AM
Published:
Jan 19, 2026 11:59 AM
Category: