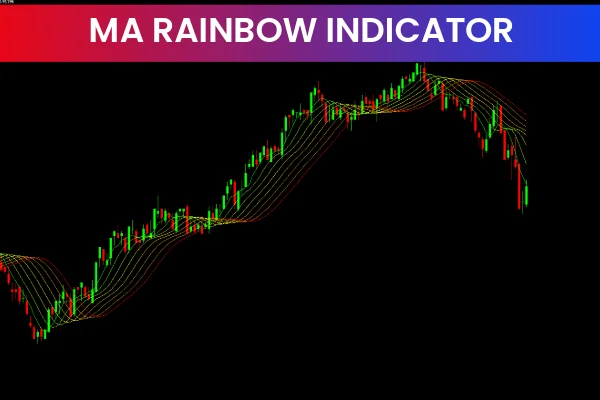
The MA Rainbow Indicator is a free and powerful MT4 Forex Indicator designed to help traders identify trend direction and strength. By combining multiple moving averages of different timeframes, this indicator visually displays market momentum, making it easier to spot profitable trading opportunities. Its colorful moving averages form a “rainbow” on the chart, which helps traders quickly assess whether a currency pair is trending strongly or moving sideways.
Widely used among forex traders, the MA Rainbow Indicator is especially useful for identifying potential trend reversals and confirming trade setups. Its visual simplicity and effectiveness make it a popular choice for both beginner and experienced traders.
How the MA Rainbow Indicator Works
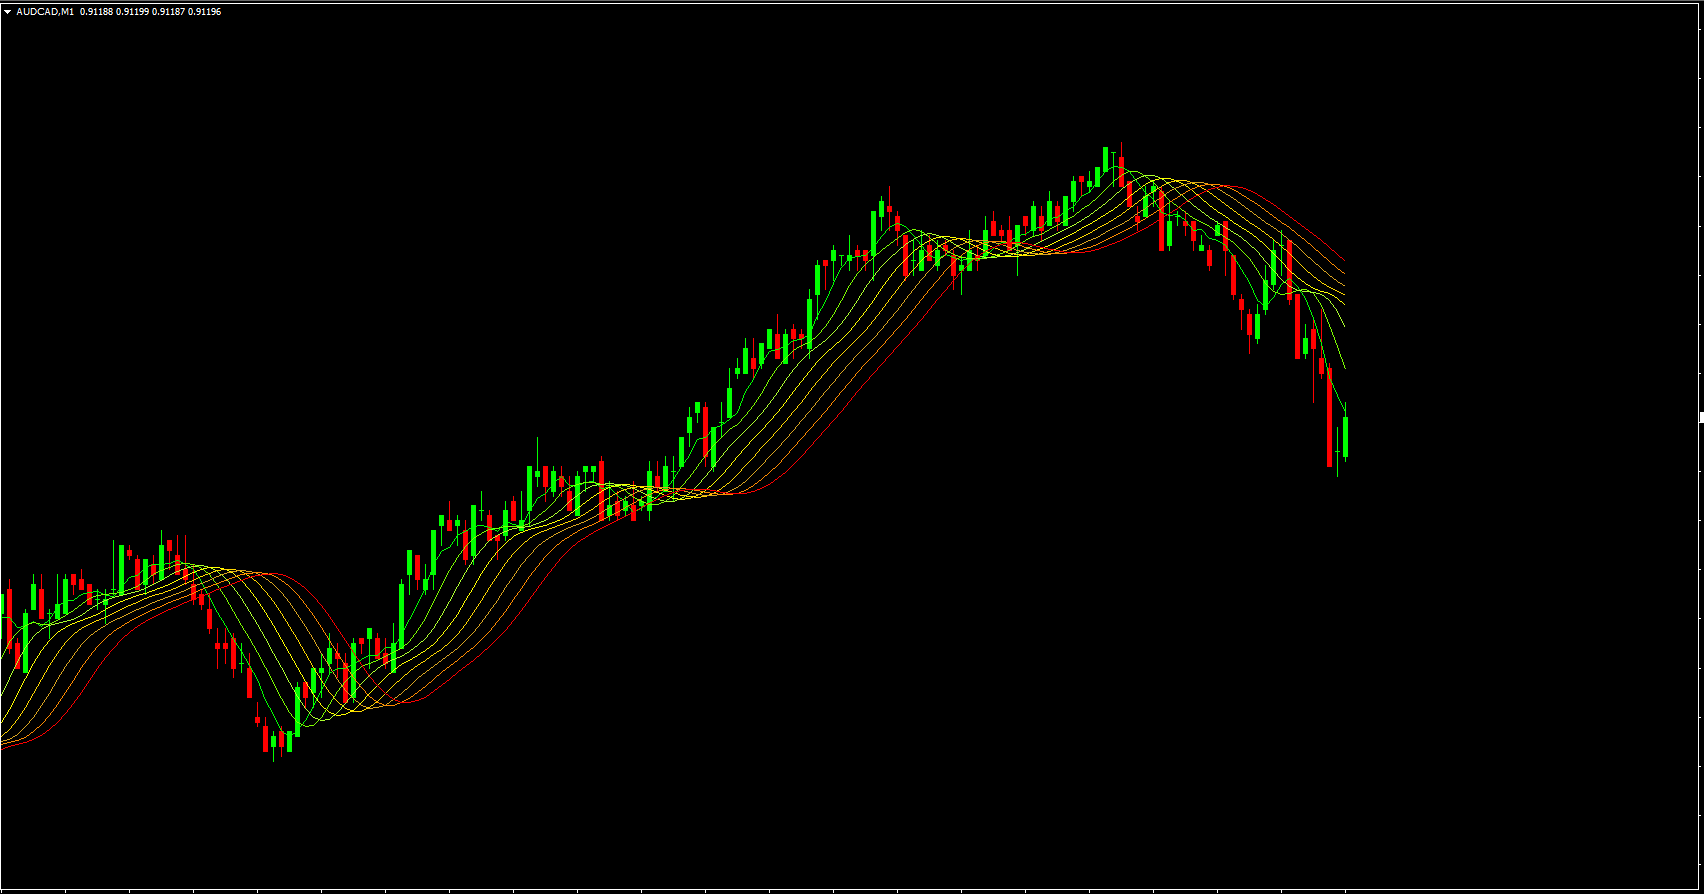
The MA Rainbow Indicator overlays several moving averages on a chart, each with a different color and period. Short-term averages react quickly to price changes, while longer-term averages provide a smoother view of the trend. The alignment and spacing of these averages determine the strength of the trend:
Strong Trend: When all moving averages are aligned in the same direction, the trend is considered strong, indicating potential trading opportunities.
Weak Trend: When moving averages are misaligned or crossing frequently, the trend is weak, signaling consolidation or uncertain market conditions.
By visually analyzing the rainbow of moving averages, traders can make quicker and more informed trading decisions.
Key Features of the MA Rainbow Indicator
Multiple Moving Average Layers
The indicator uses several moving averages of varying periods, creating a layered effect that highlights short-, medium-, and long-term market momentum.
Color-Coded Visualization
Each moving average has a distinct color, which allows traders to quickly identify the overall trend direction without complex calculations.
Trend Strength Identification
The distance and alignment of the moving averages indicate trend strength. Wide separation signals strong momentum, while overlapping averages suggest a weakening trend or sideways market.
Free and Easy to Use
The MA Rainbow Indicator is available for free on MT4 and does not require advanced setup. Its user-friendly design makes it accessible for traders of all experience levels.
Benefits of Using the MA Rainbow Indicator
Quick Trend Analysis
The MA Rainbow Indicator simplifies trend analysis by allowing traders to visually determine the market direction and momentum at a glance.
Identify Trading Opportunities
Traders can use the indicator to find potential entry points in strong trends and avoid trades in weak or consolidating markets.
Supports Better Trade Decisions
By confirming trend strength, the MA Rainbow Indicator helps traders decide whether to enter, hold, or exit trades, improving overall trading performance.
Enhances Trading Strategy
It works well in combination with other tools such as RSI, MACD, or support/resistance levels to enhance trading strategies and reduce false signals.
Using the MA Rainbow Indicator in Trading
In an Uptrend
When the moving averages are aligned upward and spread apart, the trend is bullish. Traders may look for buy opportunities when price retraces toward the faster averages and resumes upward movement.
In a Downtrend
When moving averages are aligned downward and separated, the trend is bearish. Traders may look for sell opportunities when price rallies toward the faster averages before continuing the downtrend.
In Sideways Markets
When the moving averages cross frequently and overlap, the trend is weak or ranging. Traders should be cautious and may avoid trading until a clear trend emerges.
Why Choose the MA Rainbow Indicator from IndicatorForest.com?
At IndicatorForest.com, traders can access the MA Rainbow Indicator along with other professional MT4 tools designed to simplify market analysis and improve trading accuracy. The indicator is ideal for spotting trends, measuring momentum, and identifying potential entry and exit points.
Call to Action:
Visit IndicatorForest.com today to download the MA Rainbow Indicator and explore more high-quality forex trading tools to enhance your strategies.
FAQ
Published:
Dec 20, 2025 12:07 PM
Category: