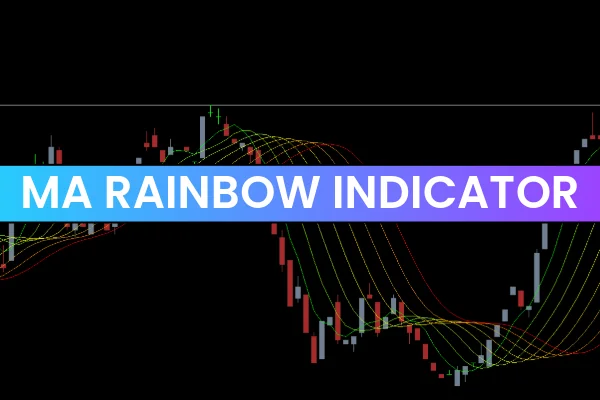
The MA Rainbow Indicator for MT4 is a collection of multiple Moving Averages designed to help forex traders identify bullish trends, bearish trends, and potential trend reversals. Since each moving average responds differently to price changes, the entire rainbow structure acts as dynamic support and resistance, making it easier for traders to place BUY and SELL trades with confidence. Trend-following traders can also ride the trend and exit once the opposite signal appears.

The indicator works well for both beginners and advanced traders. New traders can quickly recognize market direction based on the color-coded moving averages, while experienced traders can incorporate the MA Rainbow into more advanced technical strategies.
MA Rainbow Indicator for MT4 Trading Signals
The indicator displays its bullish moving averages using Green, Green-Yellow, and Yellow lines. In contrast, Red, Dark Orange, Golden Rod, and Gold represent the bearish moving averages.
The outermost moving averages (top and bottom of the rainbow) are the primary reference for trade entries and exits, while the inner moving averages help assess Trend Strength and market stability.
Bullish Signals
A bullish trend begins when the price closes above the upper Green moving average of the rainbow. This suggests strong upward momentum.
Entry: Place a BUY trade
Stop loss: Below the previous swing low
Exit: When an opposite bearish signal appears
Bearish Signals
A bearish trend begins when the price closes below the lower Red moving average.
Entry: Place a SELL trade
Stop loss: Above the previous swing high
Exit: At the next bullish reversal signal
The MA Rainbow Indicator works on all intraday timeframes as well as daily, weekly, and monthly charts. This makes it highly suitable for multi-timeframe (MTF) analysis, where traders identify the main trend on a higher timeframe and execute precise entries on a lower one.
Conclusion
The MA Rainbow Indicator for MT4 is an excellent tool for forex trend trading. It helps traders easily detect trend direction, trend strength, and reversals. The indicator is especially powerful when used with multi-timeframe strategies, helping traders capture major moves while timing entries accurately. It is free to download and easy to install, making it a valuable addition to any trader’s toolkit.
FAQ
4 Downloads
Published:
Nov 21, 2025 21:15 PM
Category: