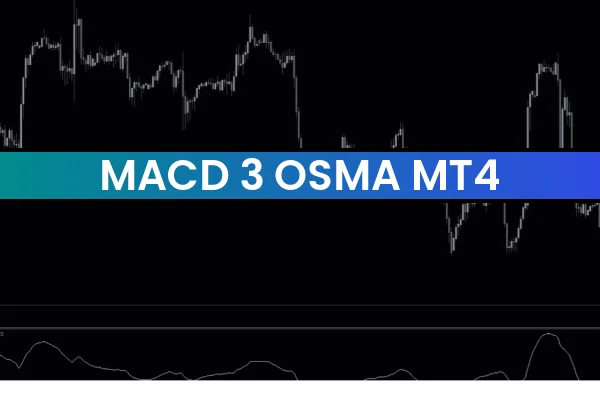
The MACD 3 OsMA Indicator is a popular and effective forex trading tool designed for the MetaTrader 4 (MT4) platform. This free indicator is widely used by traders to identify trend direction, market momentum, and potential entry or exit points with improved accuracy. By combining the power of the MACD and OsMA indicators, it provides a clearer and more detailed view of market behavior.
The MACD 3 OsMA Indicator is suitable for both beginner and experienced traders because it simplifies complex market data into easy-to-read visual signals. It helps traders confirm trends and avoid false signals that often occur in volatile market conditions.
How the MACD 3 OsMA Indicator Works
The MACD 3 OsMA Indicator works by analyzing the relationship between two exponential moving averages, along with the MACD signal line and the OsMA histogram. This combination allows traders to measure both trend direction and momentum strength at the same time.
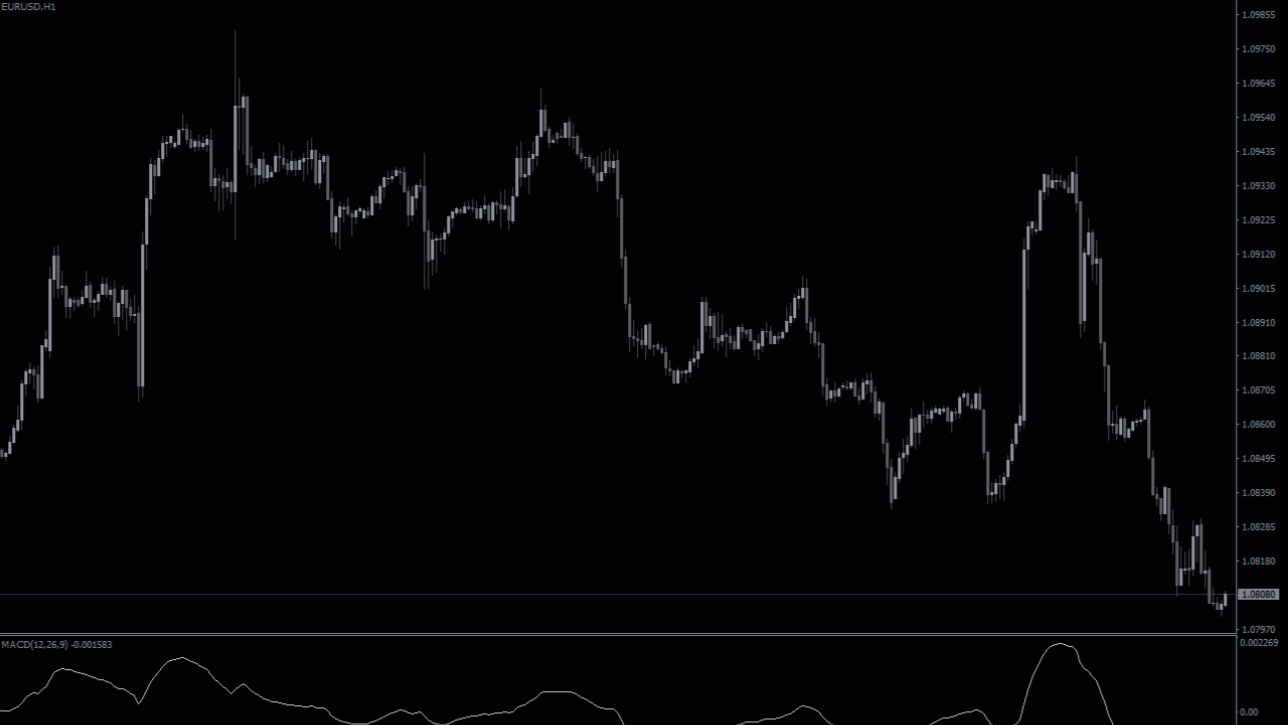
The indicator displays histogram bars that reflect the difference between the MACD line and the signal line. Positive values indicate bullish momentum, while negative values signal bearish momentum. Changes in histogram size and direction help traders anticipate possible Trend Continuation or reversal.
Key Features of MACD 3 OsMA Indicator
Combined MACD and OsMA Analysis
By merging MACD and OsMA into one indicator, traders gain deeper insight into price momentum and Trend Strength without cluttering the chart.
Clear Trend Direction
The indicator helps identify whether the market is in an uptrend, downtrend, or consolidation phase, allowing traders to align trades with market direction.
Momentum-Based Trading Signals
Rising histogram bars indicate strengthening momentum, while falling bars may suggest weakening trends or potential reversals.
How to Use MACD 3 OsMA Indicator
Installation and Setup
Download the MACD 3 OsMA Indicator for MT4
Install it in the MetaTrader 4 indicators folder
Attach the indicator to your preferred currency pair
Adjust settings if needed to match your trading strategy
Trading Signals and Interpretation
Buy Signal: Histogram crosses above the zero line with increasing momentum
Sell Signal: Histogram crosses below the zero line
Trend Weakness: Histogram bars start decreasing in size
Trading Example
On a USD/JPY chart, the MACD 3 OsMA Indicator shows the histogram moving above the zero line with increasing bar size. This confirms bullish momentum and supports a buy trade. When the histogram later begins shrinking and crosses below zero, it signals weakening momentum and a potential sell opportunity.
Advantages of MACD 3 OsMA Indicator
Combines trend and momentum analysis
Reduces false trading signals
Easy-to-read histogram display
Works on all currency pairs and timeframes
Suitable for Scalping, day trading, and swing trading
Free and fully compatible with MT4
Using the MACD 3 OsMA Indicator helps traders make more disciplined decisions and improves overall trading confidence.
Conclusion
The MACD 3 OsMA Indicator MT4 is a powerful and reliable forex trading tool that combines trend identification with momentum analysis. Its clear signals and flexible usage make it an excellent choice for traders looking to improve their technical analysis. Visit IndicatorForest.com today to download the MACD 3 OsMA Indicator for free and strengthen your MT4 trading strategy.
FAQ
MACD 3 OSMA combines MACD (Moving Average Convergence Divergence) with 3-line analysis and OSMA (MACD Histogram). It provides comprehensive trend and momentum analysis through multiple MACD components.
Three-line analysis provides multiple confirmation signals, shows trend direction through line alignment, identifies momentum strength through line spacing, and offers stronger signals than single-line MACD.
When all three lines align above zero, it indicates strong bullish trend. When aligned below zero, it suggests strong bearish trend. Line crossovers provide entry signals, and OSMA shows momentum strength.
Use for trend-following when lines align, momentum trading on line crossovers, trend confirmation for other strategies, and comprehensive MACD analysis with multiple components.
Multi-line MACD provides stronger confirmation, reduces false signals, offers comprehensive trend analysis, and combines multiple MACD components for more reliable trading signals.
Published:
Dec 16, 2025 13:50 PM
Category: