Unlocking Complete Market Synergy: Trading Momentum and Order Flow with the MACD and Volumes Indicator
In the highly competitive arena of forex trading, retail operators often fail by tracking Price Action in a complete structural vacuum. Moving average oscillators excel at displaying market velocity and trend acceleration, but they are entirely blind to whether a move is supported by real institutional capital. Conversely, standalone volume bars highlight active market participation but offer no structural context regarding directional momentum. The MACD and Volumes Indicator for MT4/MT5 solves this foundational blind spot, combining advanced trend-tracking moving average convergence divergence formulas with professional tick volume tracking into a unified technical ecosystem.
Decoding the Dual-Engine Sub-Window on EUR/USD M5
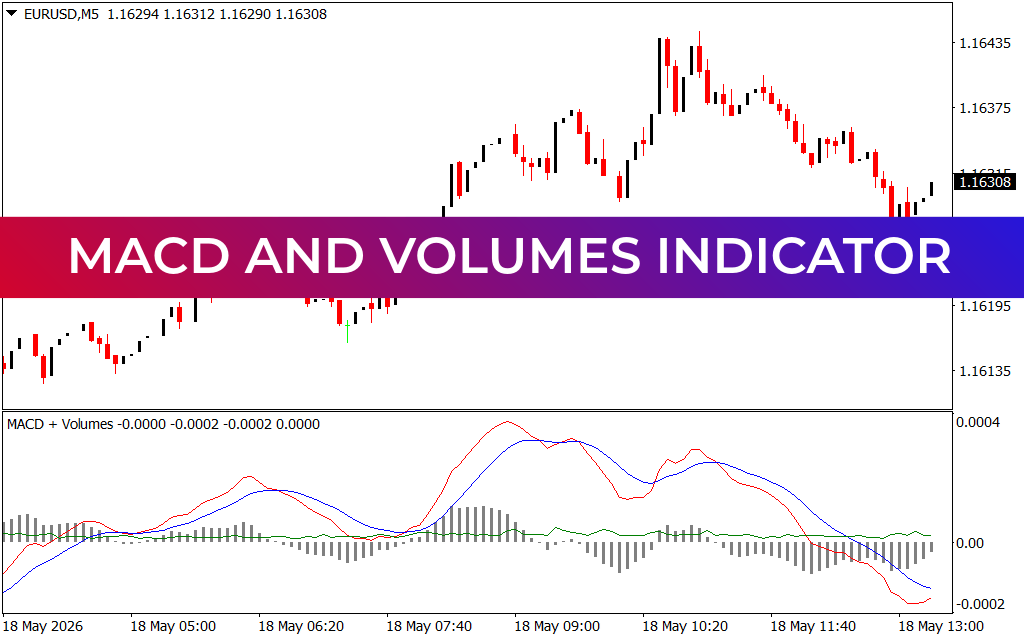
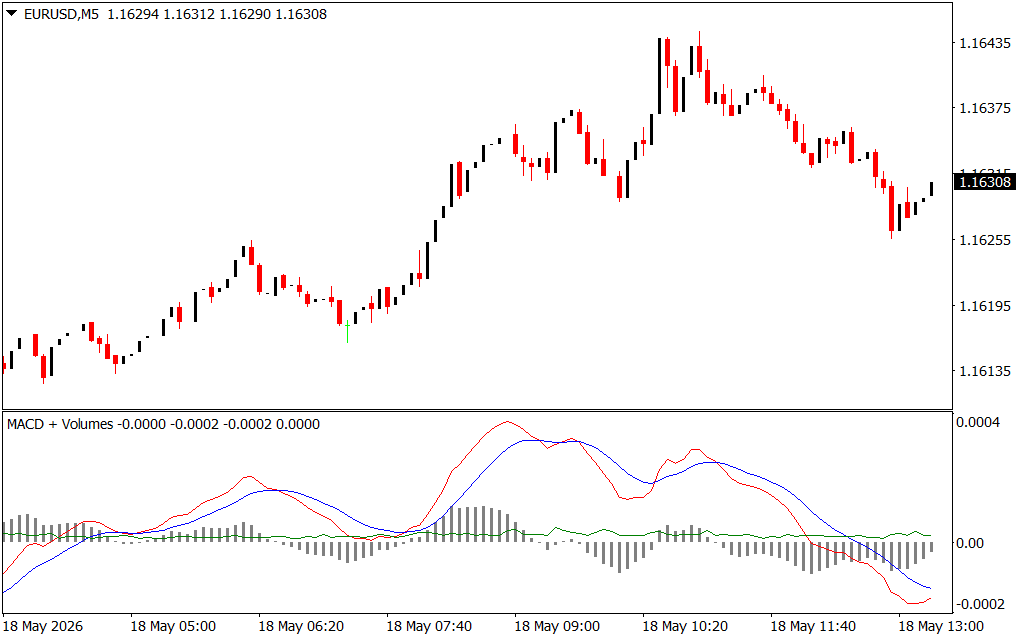
The provided EUR/USD 5-minute (M5) chart showcases the profound structural clarity this multi-dimensional tool delivers during active intra-day trading sessions. Located in the indicator sub-window, the indicator plots a responsive blue MACD line, a red signal line, and a grey volume-weighted histogram oscillating around a central 0.00 baseline.
Early in the May 18 trading session, the asset established a firm accumulation floor near the 1.16135 liquidity pocket. During this sideways consolidation, the blue and red lines remained tightly intertwined near the zero line, while the grey histogram bars remained exceptionally shallow. This technical signature warns scalpers of an active market squeeze, indicating that large market participants have not yet deployed heavy volume.
The true tradeable breakout materialized as price cleared the 1.16195 structural ceiling. As the candlesticks expanded upward, the blue line crossed decisively above the red signal line, while the grey histogram bars surged aggressively above the 0.00 baseline. For an intra-day momentum scalper, this synchronized behavior provides an immediate confirmation: the upward breakout is backed by legitimate institutional volume, eliminating the threat of a premature retail stop-run.
Spotting Trend Exhaustion and Institutional Distribution
The primary benefit of merging momentum line crossovers with volume distribution profiles is the ability to spot market tops and trend reversals before they catch retail accounts off guard. Following a massive vertical expansion, the EUR/USD pair printed a distinct double-top formation near the 1.16435 level between the 08:50 and 10:10 session markers.
While the price chart attempted to retest its previous swing highs, a glance at the MACD and Volumes indicator sub-window reveals a glaring structural divergence. The second price peak was accompanied by a visibly lower cycle on both the blue momentum line and the underlying volume histogram. This visual proof shows that institutional buying power was actively drying up at higher price levels.
As the blue line crossed beneath the red signal line and the volume histogram collapsed back toward the zero threshold, the tool provided an early confirmation of a trend rotation. Currently trading at 1.16308, the indicator has entered negative territory, giving day traders a safe, low-risk environment to short the market with tight stop-losses set safely above the distribution peak.
3 Downloads
Last Update:
May 18, 2026 16:26 PM
Published:
Jan 20, 2026 13:02 PM
Category: