Visualizing Market Velocity: The MACD Colored Histogram Indicator for MT4
In technical analysis, the Moving Average Convergence Divergence (MACD) stands as an undisputed titan. Developed by Gerald Appel, this legendary momentum oscillator has guided generations of retail and institutional traders in capturing major trend reversals. However, the standard MACD layout built into native MetaTrader platforms features a significant limitation: its monochrome presentation makes it difficult to assess sudden momentum shifts at a glance. In high-velocity trading environments, waiting for a signal line crossover or reading minor changes in single-colored bars can delay execution. The MACD Colored Histogram indicator eliminates this bottleneck by turning raw mathematical variance into a responsive, color-coded dashboard.
By breaking down the precise relationship between momentum expansion and contraction across a clear zero-axis threshold, this essential charting utility simplifies trend scouting for day traders and scalpers alike.
The Anatomy of the Four-Color Momentum Dashboard
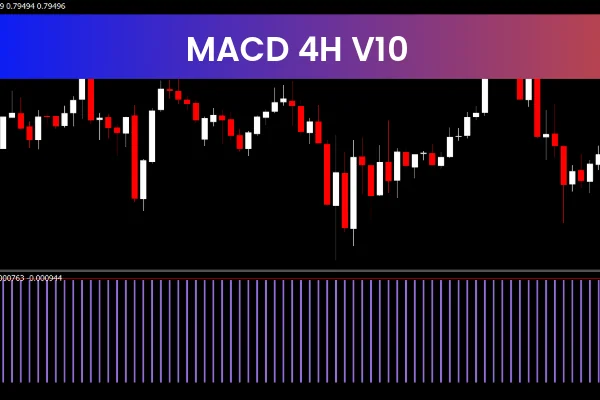
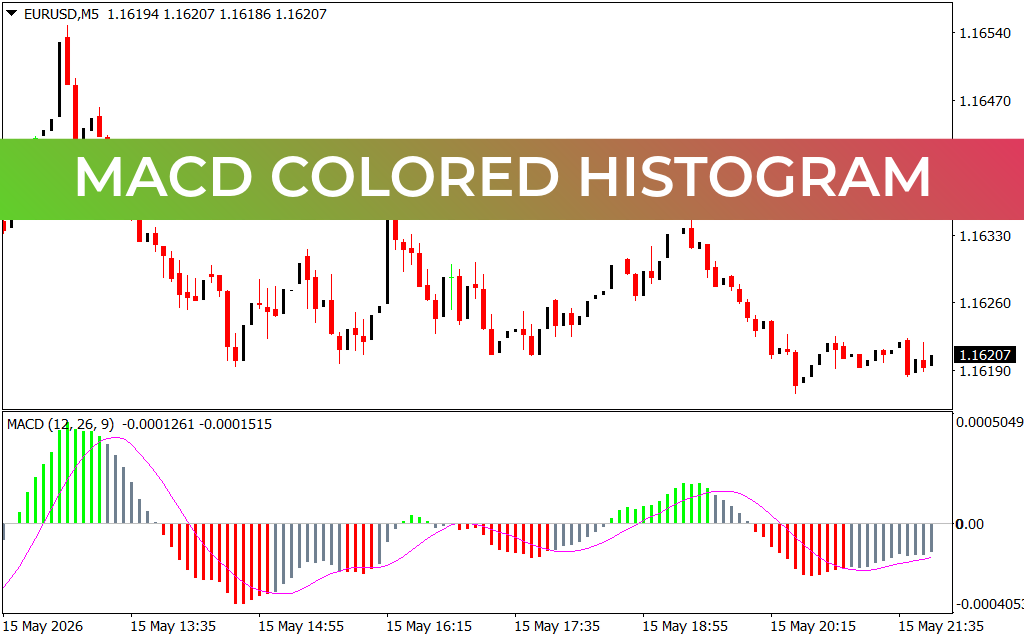
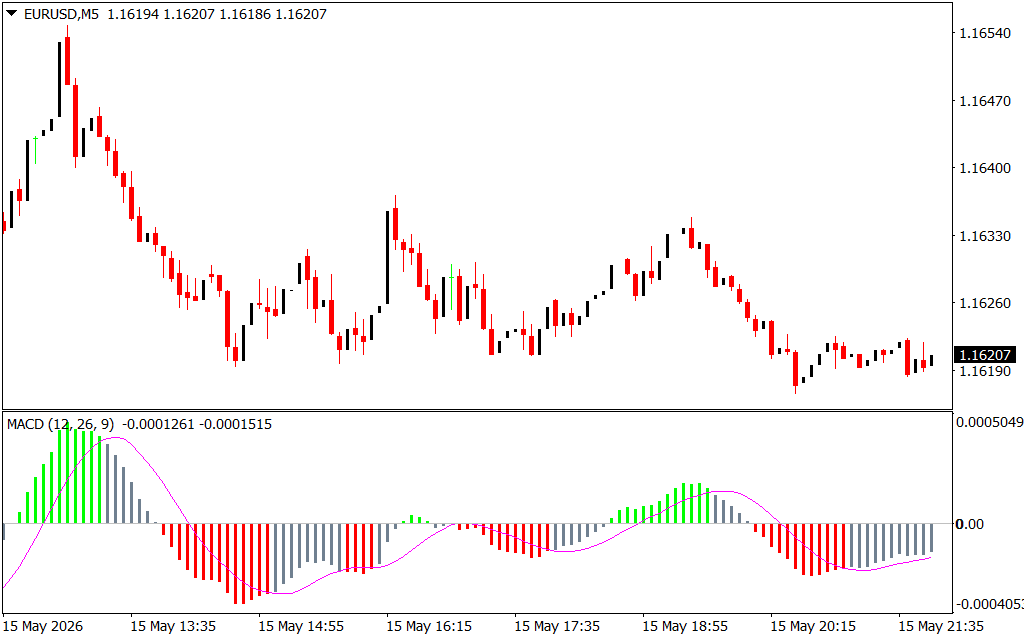
Operating smoothly out of a dedicated sub-window below your price candlesticks, the tool reads underlying moving average metrics and translates them into an intuitive, four-color histogram system. When tracking highly liquid pairs like the EUR/USD on a 5-minute (M5) chart, the system provides an immediate micro-bias health check:
- Aggressive Bullish Expansion (Dark Green Bars): When the MACD histogram trades above the 0.00 baseline and each successive bar closes higher than the previous one, the bars turn dark green. This confirms powerful, accelerating upward momentum fueled by institutional buying volume.
- Fading Bullish Conviction (Light Green Bars): When the price remains above the zero axis but the momentum begins to stall, the histogram transitions to a lighter green shade. This serves as an early structural warning that bulls are taking profit or facing overhead absorption.
- Dominant Bearish Liquidation (Maroon/Dark Red Bars): Conversely, when momentum plunges below the zero-threshold and expansions grow larger downward, the indicator prints deep maroon or dark red bars. This signals heavy institutional selling pressure, warning traders to avoid buying the dip.
- Exhausted Bearish Volume (Light Red/Pink Bars): When the downward momentum begins to lose its grip and the histogram contraction points upward back toward the zero baseline, the bars shift to light red or pink, signaling that a cyclical market bottom may be forming.
Meticulously Optimized for High-Frequency Scalping Systems
The MACD Colored Histogram utility is an indispensable asset for short-term trading styles like 5-minute Scalping or sixty-second micro-trades. It eliminates the standard lag associated with traditional crossover lines by visual tracking.
Instead of guessing whether a minor pullback is a true Trend Reversal or an institutional liquidity trap, you look at the histogram bars. A sequence of light red bars shifting to green at a major structural support level provides instant, objective confluence to execute long entries. By embedding this clean, multi-colored momentum engine into your workspace, you remove subjectivity from your trading plan and keep your execution perfectly aligned with real-time market volume.
1 Download
Last Update:
May 17, 2026 16:52 PM
Published:
Jan 20, 2026 16:12 PM
Category: