Mastering Market Trends: Why You Need MACD Directly on Your Charts
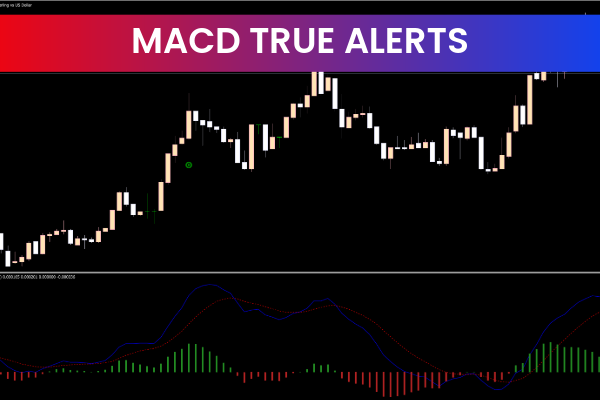
For decades, the Moving Average Convergence Divergence (MACD) has stood as a cornerstone of technical analysis. Traders across forex, equities, and crypto rely on it to gauge momentum and spot potential trend reversals. However, the traditional MACD indicator comes with a major spatial flaw: it sits in a separate window at the bottom of your screen.
Constantly shifting your gaze between Price Action candles and a sub-window causes split-second delays—delays that can cost you money in fast-moving markets. That is where a MACD on charts indicator completely changes the game. By overlaying critical momentum signals directly onto your main price screen, you streamline your visual workflow and execute trades with unprecedented precision.
The Power of Visual Convergence
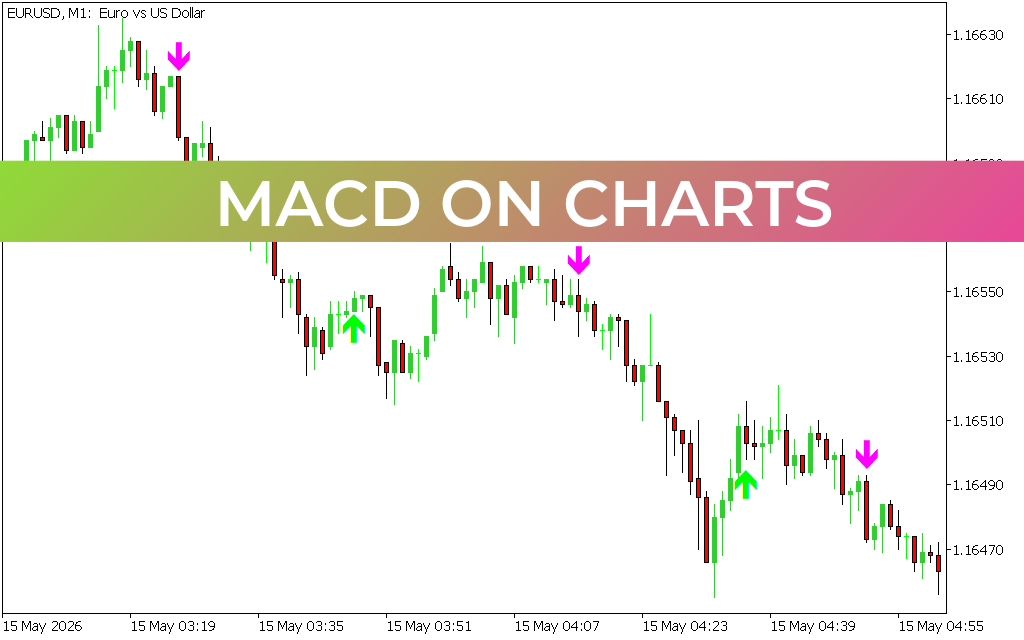
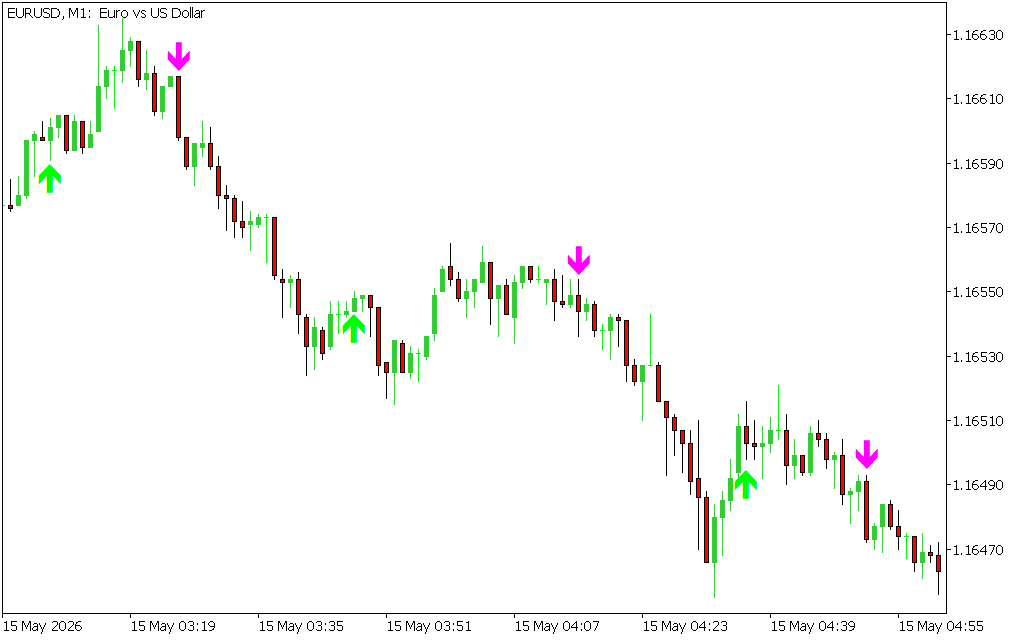
When trading currency pairs like the EUR/USD, timing is everything. A standard MACD forces your brain to manually align a histogram peak or a signal line cross with a specific candlestick.
An on-chart MACD indicator eliminates this friction by using intuitive visual cues, such as green buy arrows and magenta sell arrows, plotted directly above or below the price candles.
- Instant Execution: You no longer need to look down to confirm a cross. The moment the momentum shifts, the signal appears right where your eyes are already focused.
- Reduced Cognitive Load: Merging price action and momentum into a single visual plane allows you to spot high-probability setups faster and filters out the noise of secondary windows.
- Perfect for Scalping: On lower timeframes like the 1-minute (M1) chart, trends emerge and vanish in sixty seconds. On-chart indicators ensure you catch the exact micro-Trend Reversal without hesitation.
Spotting Winning Setups Directly on the Price Action
An on-chart MACD thrives in trending markets, offering clear entries during pullbacks. Look at how beautifully it maps out Market Structure:
- Riding the Downtrend: In a established bearish move, the market naturally breathes and pulls back upward. Instead of guessing when the correction is over, the on-chart MACD prints a magenta down-arrow at the exact moment bearish momentum resumes, letting you short the market with tight risk parameters.
- Catching the Reversal: When the price bottoms out and prints a strong bullish rejection candle, the immediate appearance of a green up-arrow provides instant confirmation to switch biases and go long.
By keeping your charts clean and your signals centralized, you can comfortably monitor multiple assets without suffering from analysis paralysis. It turns a complex mathematical formula into a sleek, actionable visual map.
6 Downloads
Last Update:
May 17, 2026 15:56 PM
Published:
Jan 20, 2026 21:58 PM
Category: