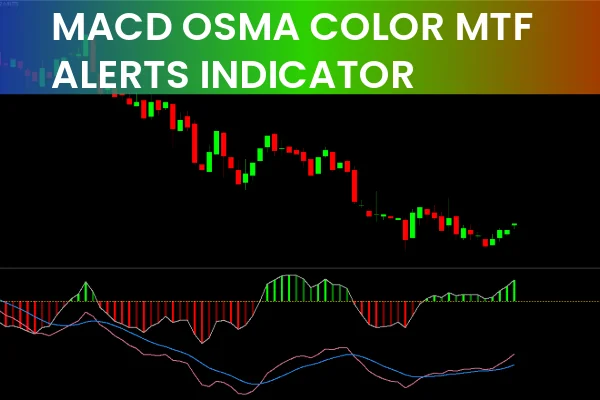
The MACD OSMA Color MTF Alerts Indicator for MetaTrader 4 (MT4) is a powerful forex trading tool that merges two classic indicators — the MACD (Moving Average Convergence Divergence) and the OsMA (Oscillator of Moving Average) — to generate highly accurate trading signals across multiple timeframes.
By combining these two technical indicators, the MACD OSMA Color MTF Alerts Indicator for MT4 helps traders identify high-probability trend reversals and momentum shifts while filtering out false market movements. This indicator is especially valuable for traders who rely on multi-timeframe confirmation to improve entry precision and reduce trading noise.
How the MACD OSMA Color MTF Alerts Indicator Works
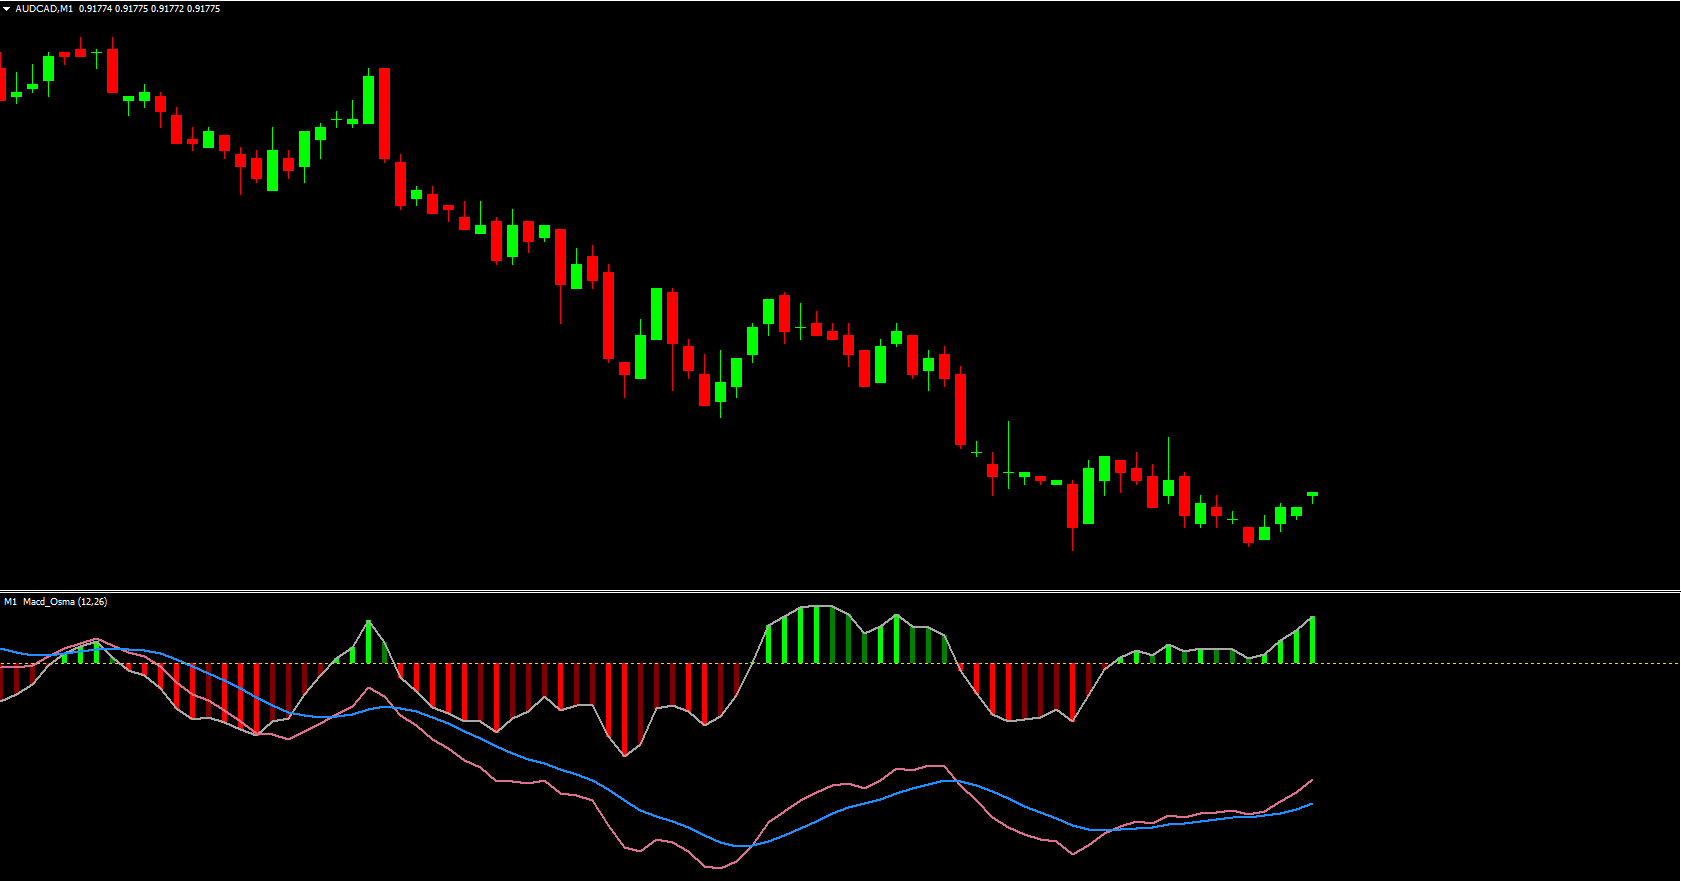
The MACD OSMA Color MTF Alerts Indicator for MT4 visually represents both MACD and OsMA data in a unified interface. It uses color-coded histograms and signal lines to display trend direction, momentum strength, and potential reversal zones.
MACD Component
The MACD identifies whether the market is bullish or bearish:
Green histogram bars above the zero line indicate a bullish trend.
Red histogram bars below the zero line signal a bearish market.
When the MACD histogram changes color, it indicates momentum weakening or potential reversal.
OsMA Component
The OsMA measures the distance between the MACD line and its signal line.
When the OsMA lines cross above the zero level, it suggests a buy opportunity.
When they cross below zero, it signals a sell setup.
The indicator only confirms a valid trade when both MACD and OsMA signals align, ensuring that traders act on strong market confluence rather than isolated conditions.
How to Trade Using MACD OSMA Color MTF Alerts Indicator
Trading with the MACD OSMA Color MTF Alerts Indicator for MT4 involves waiting for confirmation between the two indicators to minimize false entries.
Buy Signal Setup
Wait for the OsMA lines to cross upward, signaling potential bullish momentum.
Confirm that the MACD histogram is green and above the zero line.
Open a buy position and set stop-loss below the recent swing low.
Exit the trade when the MACD histogram turns red or the OsMA crosses downward.
Sell Signal Setup
Wait for the OsMA lines to cross downward, showing a possible bearish reversal.
Confirm that the MACD histogram turns red and stays below the zero line.
Enter a sell trade and place your stop-loss above the nearest swing high.
Take profit when the indicators signal weakening momentum.
Additional Tip: Multi-Timeframe Strategy
Because this is an MTF (Multi-Timeframe) indicator, traders can view higher timeframe signals (e.g., H4 or D1) on a lower timeframe chart (e.g., M15 or M30). This enables top-down analysis, ensuring your entries align with the dominant market trend.
Why Use the MACD OSMA Color MTF Alerts Indicator
Confluence Confirmation: Combines two reliable indicators for stronger trade validation.
Real-Time Alerts: Get instant email or pop-up notifications for trade setups.
Noise Filtering: Reduces false signals during ranging or low-volatility markets.
Trend Reversal Accuracy: Ideal for spotting early reversals and continuation patterns.
Scalable Across Assets: Works on forex, stocks, commodities, and indices.
The MACD OSMA Color MTF Alerts Indicator for MT4 can be used alone or alongside other trend-based tools such as Moving Averages or RSI indicators to enhance precision.
Conclusion
The MACD OSMA Color MTF Alerts Indicator for MT4 is a comprehensive trading tool for identifying trend reversals and high-probability setups. By combining the strengths of MACD and OsMA, it filters out weak signals and provides accurate, multi-timeframe trade alerts.
Whether you’re a beginner or experienced trader, this indicator can help refine your trading strategy, increase your win rate, and simplify decision-making.
Download the MACD OSMA Color MTF Alerts Indicator for MT4 today at IndicatorForest.com and take advantage of its professional-grade trading insights.
FAQ
17 Downloads
Published:
Nov 13, 2025 00:08 AM
Category: