The MACD True Indicator is a highly useful tool for traders using the MetaTrader 4 (MT4) platform. Designed to analyze market trends and momentum, it helps traders identify potential entry and exit points with accuracy. Available for free on IndicatorForest.com, this indicator is suitable for traders of all skill levels—from beginners to experienced Forex traders.
Understanding the MACD True Indicator
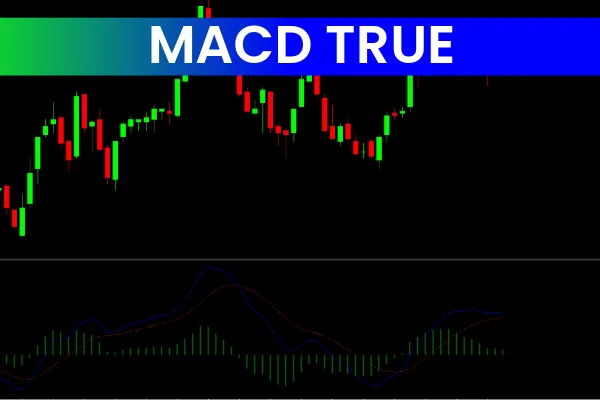
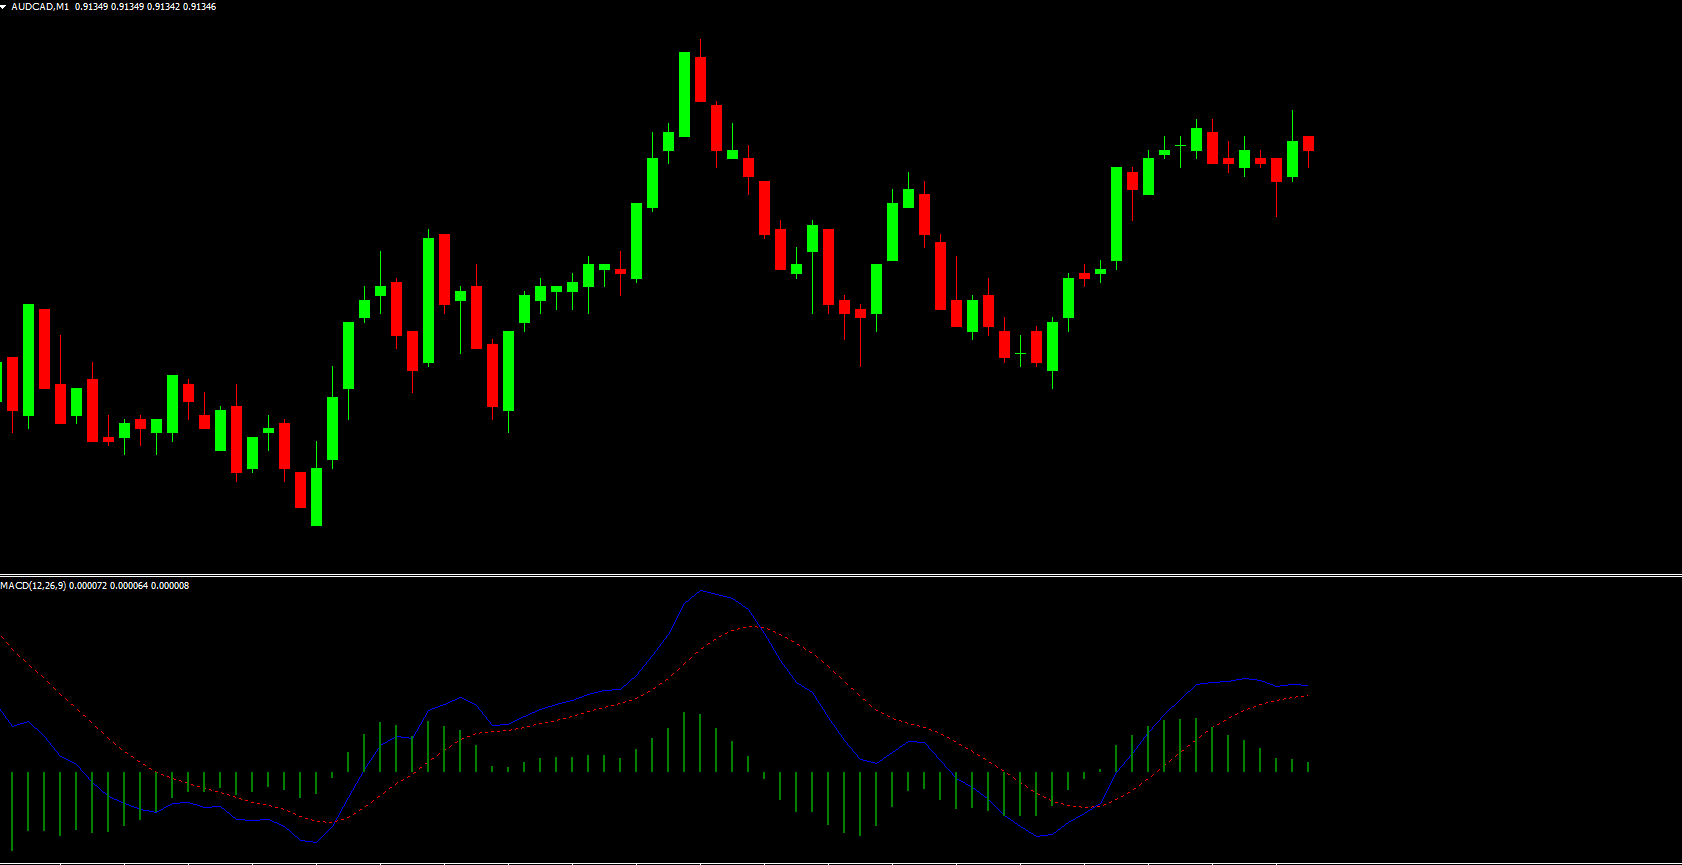
The MACD True Indicator works by measuring the difference between two Exponential Moving Averages (EMAs) and plotting that difference as a histogram. The histogram visually represents market momentum, making it easier to detect trend changes.
Key Features of the MACD True Indicator
Trend Identification: The histogram helps traders quickly identify bullish and bearish trends.
Momentum Analysis: Measure the strength of price movements and assess market conditions.
Buy/Sell Signals: Signals are generated when momentum shifts, allowing traders to make timely trading decisions.
User-Friendly: The indicator’s clear visual display makes it suitable for both beginners and advanced traders.
Benefits of Using the MACD True Indicator
Accurate Trend Signals: Helps traders identify trend reversals and continuation patterns with confidence.
Enhanced Decision-Making: The histogram makes it easier to gauge market momentum and potential trade setups.
Versatile Trading Tool: Can be used for Scalping, day trading, or swing trading strategies.
Free and Accessible: Available on IndicatorForest.com, providing a reliable tool without cost.
How to Use the MACD True Indicator Effectively
Traders can combine the MACD True Indicator with Support And Resistance levels, or other technical indicators like RSI and moving averages, to confirm trade setups. Watching histogram changes and zero-line crossings helps anticipate momentum shifts and optimize trading entries and exits.
Explore more indicators and trading tools at IndicatorForest.com to enhance your Forex trading strategy. Our guides and tutorials are designed to help traders of all experience levels maximize their potential in the market.
FAQ
The MACD True Indicator measures the difference between two Exponential Moving Averages (EMAs) and plots that difference as a histogram. The histogram visually represents market momentum, making it easier to detect trend changes. The indicator helps traders identify potential entry and exit points by analyzing momentum shifts and trend strength.
The histogram helps traders quickly identify bullish and bearish trends. When the histogram is above the zero line and rising, it indicates bullish momentum. When the histogram is below the zero line and falling, it suggests bearish momentum. Changes in histogram direction and zero-line crossings help anticipate momentum shifts and optimize trading entries and exits.
Buy signals are generated when momentum shifts to bullish, typically when the histogram crosses above the zero line or shows increasing positive values. Sell signals occur when momentum shifts to bearish, usually when the histogram crosses below the zero line or shows decreasing values. These signals help traders make timely trading decisions based on momentum changes.
Combine the MACD True Indicator with support and resistance levels, or other technical indicators like RSI and moving averages, to confirm trade setups. Watch histogram changes and zero-line crossings to anticipate momentum shifts and optimize trading entries and exits. The indicator is versatile and can be used for scalping, day trading, or swing trading strategies.
Yes, the indicator's clear visual display makes it suitable for both beginners and advanced traders. The histogram representation makes it easier to gauge market momentum and potential trade setups compared to traditional MACD line analysis. It is free and accessible, providing a reliable tool for traders of all skill levels.
2 Downloads
Published:
Dec 15, 2025 23:04 PM
Category: