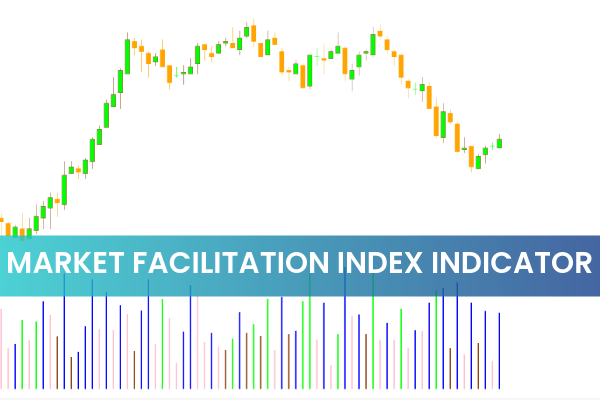
The Market Facilitation Index (MFI) is a unique indicator developed by Bill Williams to evaluate how efficiently the market reacts to changes in trading volume. Unlike classical indicators derived from moving averages or oscillators, the Market Facilitation Index focuses on the relationship between price movement and tick volume. Traders value MFI because it helps them understand trend strength, potential reversals, and changes in market participation.
What Is the Market Facilitation Index?
The Market Facilitation Index measures how much the price moves per unit of volume. It serves as a tool to determine market efficiency, sentiment, and the likelihood of Trend Continuation or exhaustion. Williams introduced the MFI in his famous book Trading Chaos, where he referred to it as one of the most effective tools for analyzing market reaction to volume.
How to Calculate the Market Facilitation Index
The formula is simple:
MFI = (High – Low) / Volume
Where:
High – Highest price of the current candle
Low – Lowest price of the current candle
Volume – Tick volume of the candle
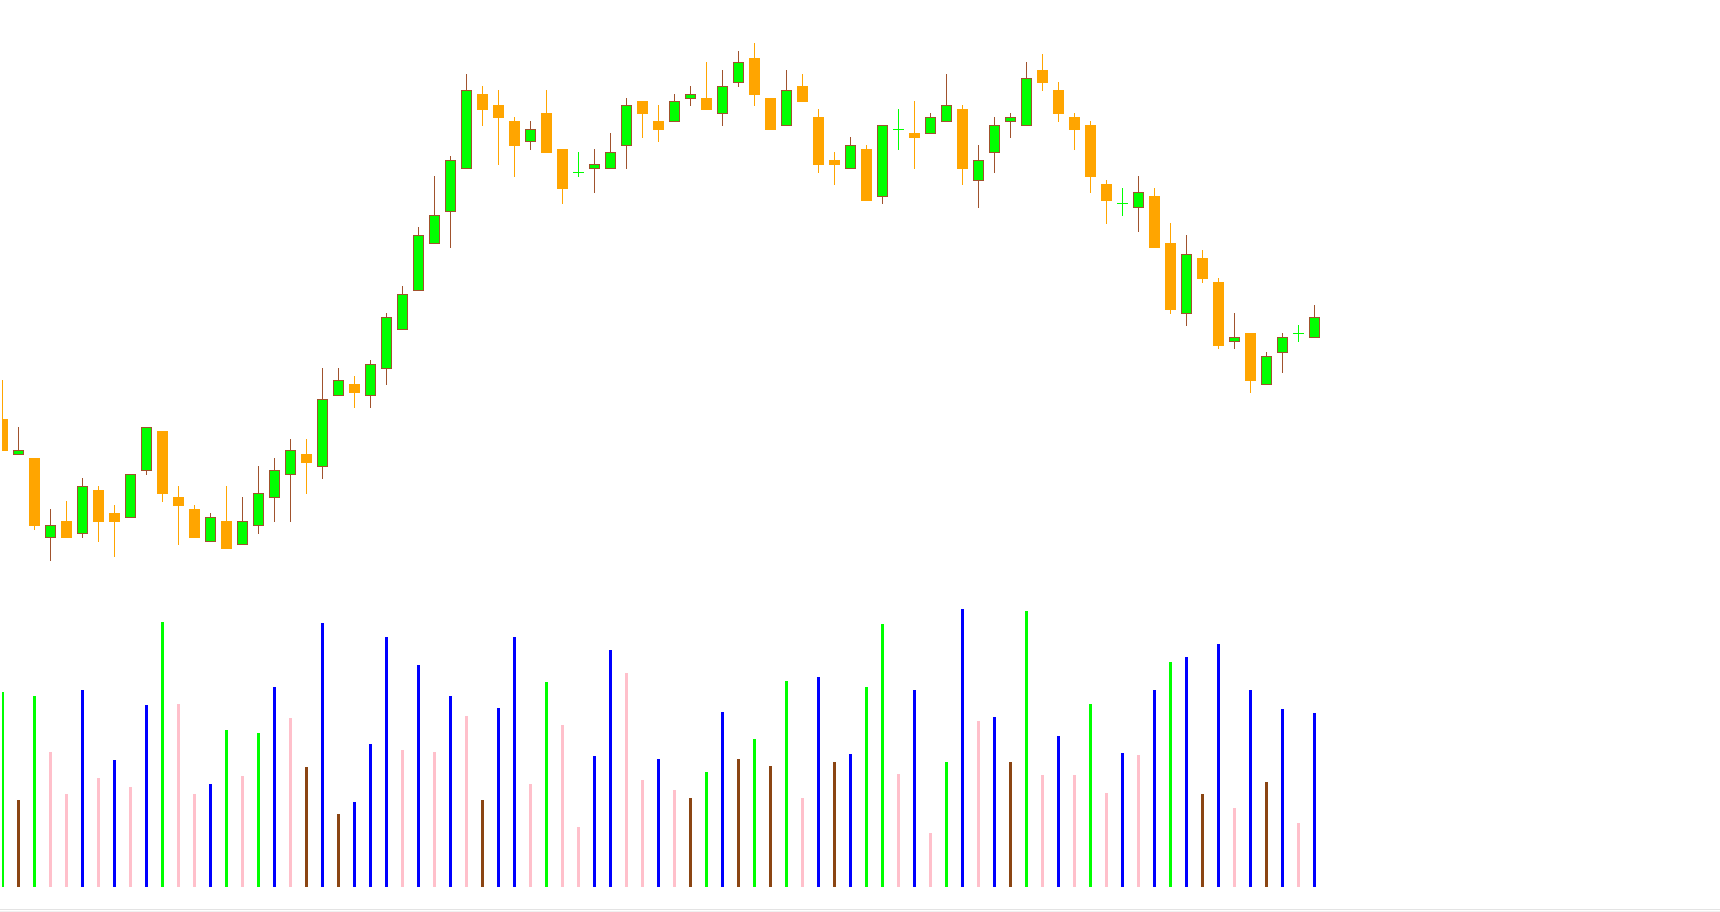
The resulting value is displayed in histogram form, which changes color based on market behavior.
Understanding MFI Histogram Colors
Green Bar – Trend Strengthening
A green bar indicates:
Increasing volume
Expanding price movement
Growing market participation
This combination suggests a strong and likely sustainable trend. Although not a direct entry signal, it validates existing trades. Traders often use it as confirmation when already positioned in the direction of the trend.
Brown Bar – Weakening Market Activity
A brown bar shows:
Decreasing volume
Decreasing price movement
This means the prior trend is losing strength. The market may be preparing for a sideways phase. It is not recommended to open new positions during brown bars, as clarity is lacking and trend continuation is uncertain.
Blue Bar – Low Interest but Ongoing Movement
The blue bar signals:
Decreasing volume
Increasing price movement
Here, a price move is happening without strong participation from either buyers or sellers. Such moves may collapse quickly. Caution is advised because the signal indicates market uncertainty.
Pink Bar – High Activity and Reversal Potential
A pink bar is the most significant:
Increasing volume
Narrower price movement
This suggests intense activity from both buyers and sellers. Pink bars often precede trend reversals or significant breakouts. Many traders closely monitor pink bars for early entry setups.
Market Facilitation Index Trading Strategy
Buy Setup Using the MFI
A potential buy opportunity occurs when:
A pink bar appears on the MFI histogram.
Place a buy stop order a few pips above the recent local high.
Set a stop-loss below the last local low.
Set take profit at 2–3 times the stop-loss distance or near major price levels.
Sell Setup Using the MFI
A possible sell trade is confirmed when:
A pink bar forms on the indicator.
Place a sell stop order a few pips below the latest local low.
Set stop-loss above the previous local high.
Choose a take profit target 2–3 times larger than the stop-loss.
Conclusion
The Market Facilitation Index is a powerful tool for understanding market dynamics, Trend Strength, and potential reversals. By analyzing histogram color changes and combining them with price structure, traders can gain valuable insights into when markets are gaining strength, losing momentum, or preparing for a reversal. The pink bar is especially important, as it often anticipates critical turning points.
For more trading tools, guides, and advanced indicators, visit IndicatorForest.com.
FAQ
2 Downloads
Published:
Nov 13, 2025 22:17 PM
Category: