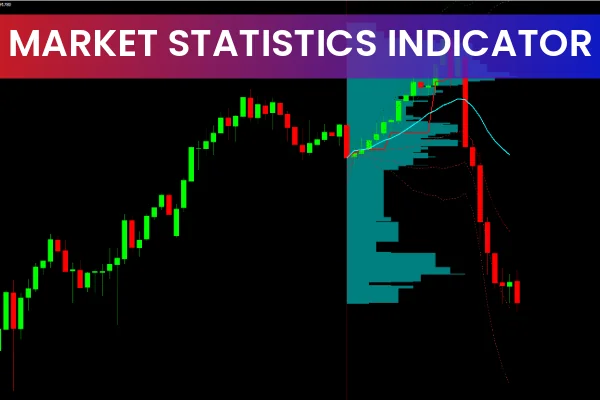
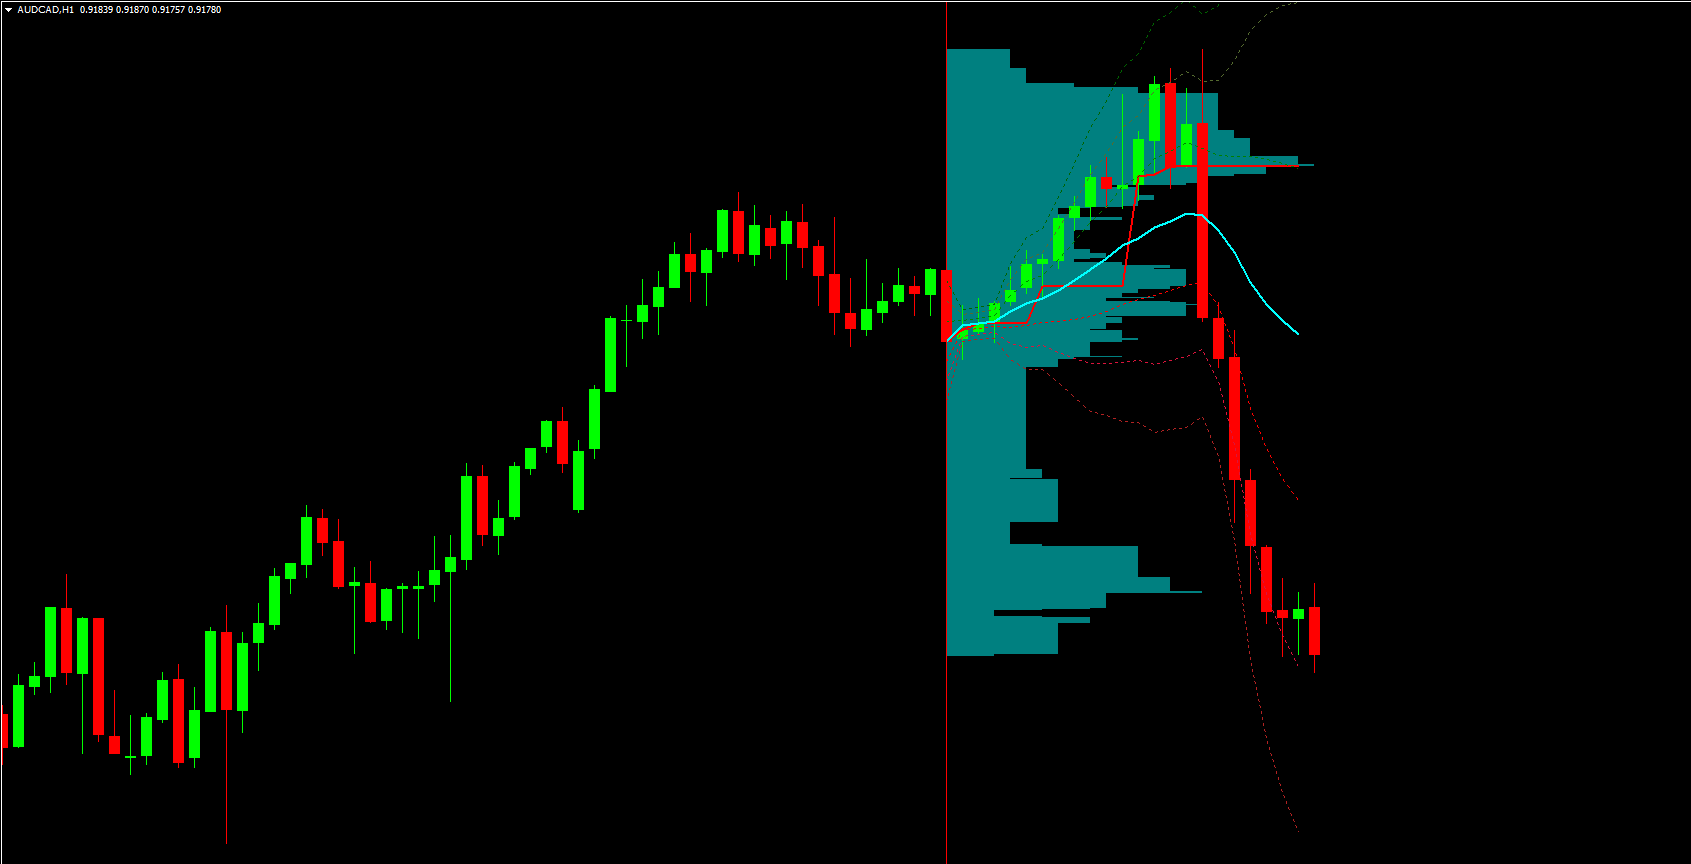
The Market Statistics Indicator is a robust analytical tool designed for traders who want a deeper understanding of market behavior. By examining price movement, volume flow, and statistical boundaries, it helps traders identify key market levels, volatility extremes, and optimal trade zones. This makes it especially valuable for strategy builders who rely on data-driven and statistical analysis.
Market Statistics Indicator Trading Signals
The indicator calculates and displays essential statistical metrics, including:
Standard Deviations (SD1, SD2, SD3) – reveal market volatility zones
Volume-Weighted Average Price (VWAP) – shows where the average trading activity occurs
Point of Volume Profile (PVP) – highlights high-volume price levels where strong buying or selling interest is present
Using Standard Deviations
Price breaking above SD3 → extreme volatility, possible exhaustion or reversal zone
Price holding near SD1 or SD2 → normal volatility and potential continuation area
Using VWAP
Price above VWAP → bullish bias (buyers dominate)
Price below VWAP → bearish bias (sellers dominate)
Using Volume Profile (PVP)
The histogram reveals where the largest volume occurred, marking strong support or resistance. These levels often act as reaction points for trend continuation or reversal.
When combined, these statistical elements offer a complete picture of Market Structure, letting traders make accurate decisions on entries, exits, and stop-loss placement.
Conclusion
The Market Statistics Indicator is an essential tool for traders who rely on statistical analysis, volume data, and market structure. Its visual clarity and customizable features help traders monitor real-time volatility, identify activity zones, and improve accuracy in both trend-following and countertrend strategies.
Download the Market Statistics Indicator today to enhance your trading precision and gain a measurable statistical edge.
FAQ
4 Downloads
Published:
Dec 07, 2025 10:27 AM
Category: