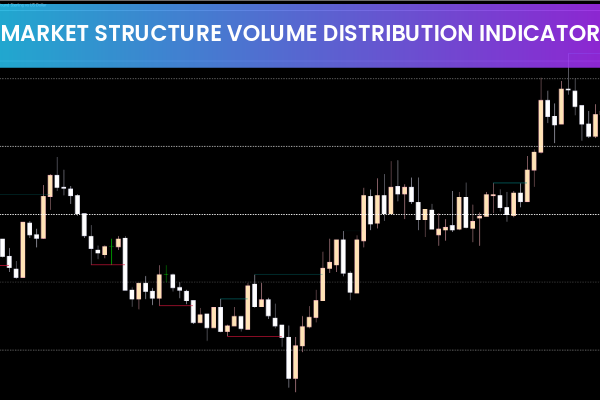
The Market Structure Volume Distribution Indicator for MT5 by LuxAlgo provides a cutting-edge approach to volume and structure analysis. Unlike traditional volume profile tools that rely on static zones, this indicator dynamically aligns buy and sell volume with structural turning points. It helps traders identify where price reacts and how much volume is traded at key pivot levels, offering deeper insights into accumulation, distribution, and breakout readiness.
This tool is especially valuable for intraday and swing traders who depend on order flow, structural clarity, and volume precision. With real-time distribution mapping, traders can better understand market participants’ behavior around support and resistance zones.
Why This Indicator Stands Out
Standard volume indicators often display generalized activity that doesn’t fully align with structural markets. This LuxAlgo tool solves that limitation by matching volume behavior with:
Pivot highs and lows
Structural break points
Market reaction zones
Trend shifts and liquidity sweeps
This creates a more accurate representation of where actual commitment—either bullish or bearish—is concentrated.
How the Indicator Works
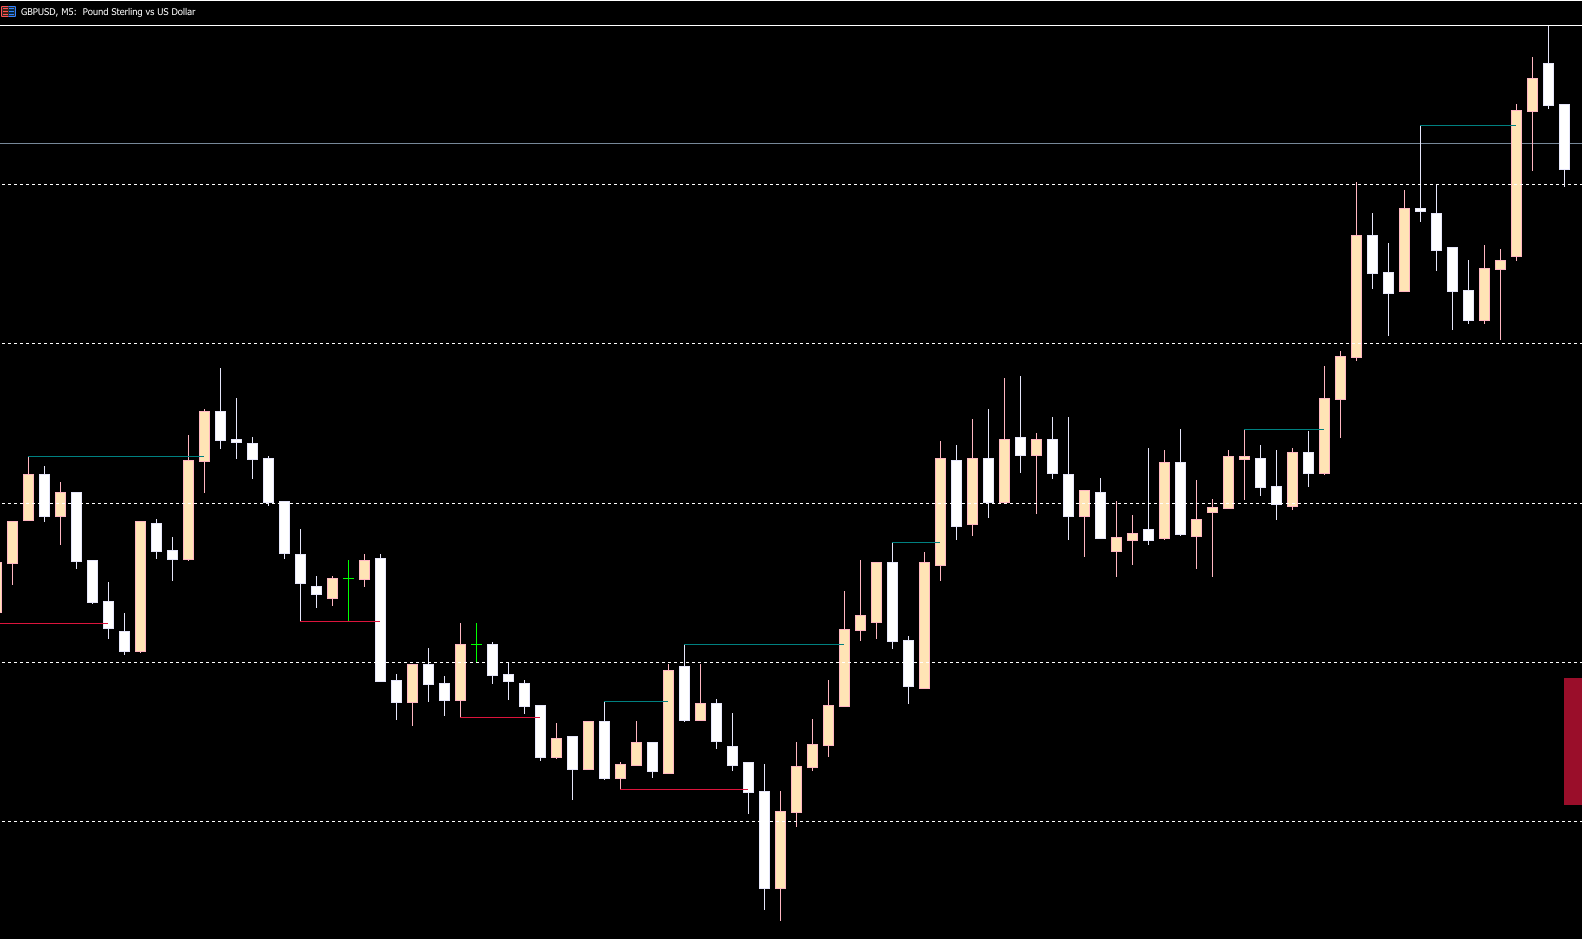
The Market Structure Volume Distribution Indicator for MT5 scans recent candles and plots buy/sell volume around pivotal structures. These areas are automatically recognized and then highlighted using color-coded segments:
Teal zones display strong buying volume
Crimson zones show concentrated selling pressure
Bullish Accumulation
When teal segments dominate around structural lows, it often signals buying absorption. This suggests that buyers are preparing for upward movement, even if price hasn’t broken out yet.
Bearish Distribution
When crimson areas expand near swing highs or resistance, it suggests sellers are offloading positions. This often precedes pullbacks, reversals, or liquidity-driven drops.
Practical Trading Applications
The Market Structure Volume Distribution Indicator for MT5 helps traders:
Validate breakout strength
Identify volume imbalances
Spot exhaustion points
Confirm liquidity sweep reactions
Detect institutional accumulation or distribution
Align entries with structural retests
Many traders use it to refine entries after a sweep of a recent high or low, waiting for volume distribution to confirm the shift.
Grid-Level Visualization
Another advanced feature is the grid-level visualization using dotted horizontal lines. These lines highlight:
Structural alignment
Equilibrium zones
Volume confluence levels
This is extremely useful for stop-loss placement, profit target mapping, and confirming whether price is reacting to historical volume nodes.
Why Traders Prefer This Indicator
Traders appreciate that it transforms raw volume data into an actionable format. Instead of requiring manual volume analysis, the indicator automatically highlights key pressure zones. This helps determine:
Who controls the move
Where liquidity builds
When momentum may shift
Whether a retest or breakout is valid
It simplifies complex volume studies while retaining depth and precision.
Conclusion
The Market Structure Volume Distribution Indicator for MT5 by LuxAlgo offers traders a unique advantage by combining market structure with volume distribution analysis. It reveals where significant buying and selling occur, making institutional footprints easier to identify before price confirms a move.
For traders seeking accuracy, clarity, and structure-based decision-making, this indicator stands out as one of LuxAlgo’s most advanced tools. To explore more trading indicators, tools, and resources, visit IndicatorForest.com.
FAQ
7 Downloads
Published:
Dec 03, 2025 00:41 AM
Category: