Master Trend Reversals with the Mass Index Indicator
Anticipating a market reversal before it happens is one of the most challenging aspects of trading. Many technical analysis tools only react after a trend has already changed direction, leaving day traders to chase the market. If you are Scalping or day trading high-liquidity assets like the EUR/USD on lower timeframes, you need a tool that specifically measures volatility to predict these crucial turning points. The Mass Index indicator is a powerful, volatility-based technical tool built to do exactly that.
What is the Mass Index Indicator?
Developed by Donald Dorsey, the Mass Index is a unique technical oscillator used to identify trend reversals by analyzing the narrowing and widening of the high-low price range. Instead of tracking the direction of the trend, the Mass Index focuses entirely on price expansion and contraction.
The underlying logic is straightforward: when the daily or intraday range widens, volatility increases; when the range narrows, volatility decreases. The indicator smooths out these fluctuations using a combination of single and double exponential moving averages (EMA)—typically set to a 9-period baseline—to compute a final value over a 25-period lookback range.
Understanding the "Reversal Bulge"
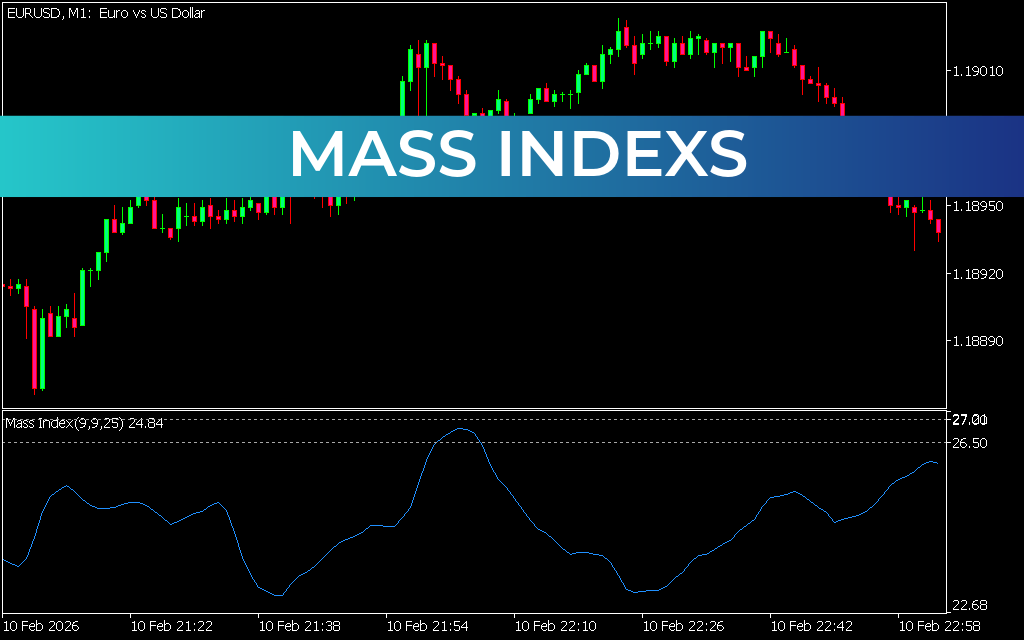
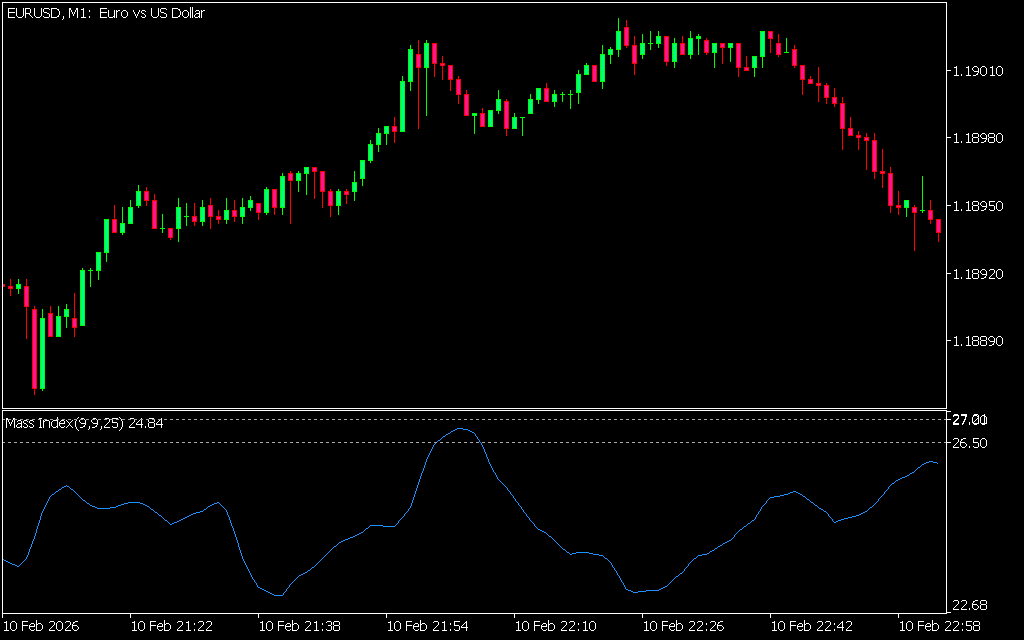
The defining feature of the Mass Index is a specific chart pattern known as the Reversal Bulge. This setup occurs when the index line experiences a sharp spike and then a subsequent contraction according to two critical thresholds:
- The Setup: The Mass Index line rises above the 27.00 horizontal threshold, signaling that price ranges are expanding rapidly and the current trend is becoming severely overextended.
- The Trigger: The line then drops back below the 26.50 level. This sudden contraction indicates that volatility is compressing, and a massive Trend Reversal is highly likely to occur.
As demonstrated on high-speed charts like the 1-minute (M1) timeframe, when the blue Mass Index line peaks and rolls over from its upper limits, it acts as an early warning system. It alerts traders that the dominant bullish or bearish momentum has exhausted itself.
How to Trade with the Mass Index
To maximize your winning percentage, the Mass Index should not be used as a standalone directional signal. Because it only gauges volatility and range expansion, it tells you when a reversal is coming, but not which direction it will take.
- Spot the Bulge: Wait for the Mass Index line to climb past 27.00 and drop back below 26.50.
- Confirm Direction: Use an auxiliary tool, such as a directional moving average or standard Price Action patterns (like double tops or engulfing candles). If the index triggers a bulge during a strong uptrend and price action stalls at resistance, prepare to enter a short position to capture the new downtrend.
Equip your platform with the Mass Index indicator today to eliminate the guesswork from volatile market shifts and master your entry timing.
Last Update:
May 19, 2026 16:09 PM
Published:
Jan 19, 2026 19:43 PM
Category: