The Max Range Bars Indicator is a popular and free Forex Indicator for the MetaTrader 4 platform that helps traders clearly identify market volatility. By transforming standard price candles into range-based bars, this indicator makes it much easier to see when the market is active and when it is quiet. For traders who rely on volatility, breakouts, and momentum, the Max Range Bars Indicator is a practical and highly effective tool.
Unlike traditional time-based candles, this indicator focuses on price movement measured in pips. As a result, traders can better understand real market activity and avoid being misled by low-volume or stagnant price periods.
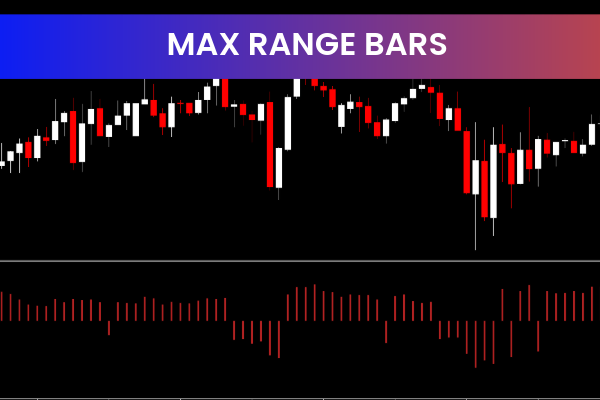
What Is the Max Range Bars Indicator?
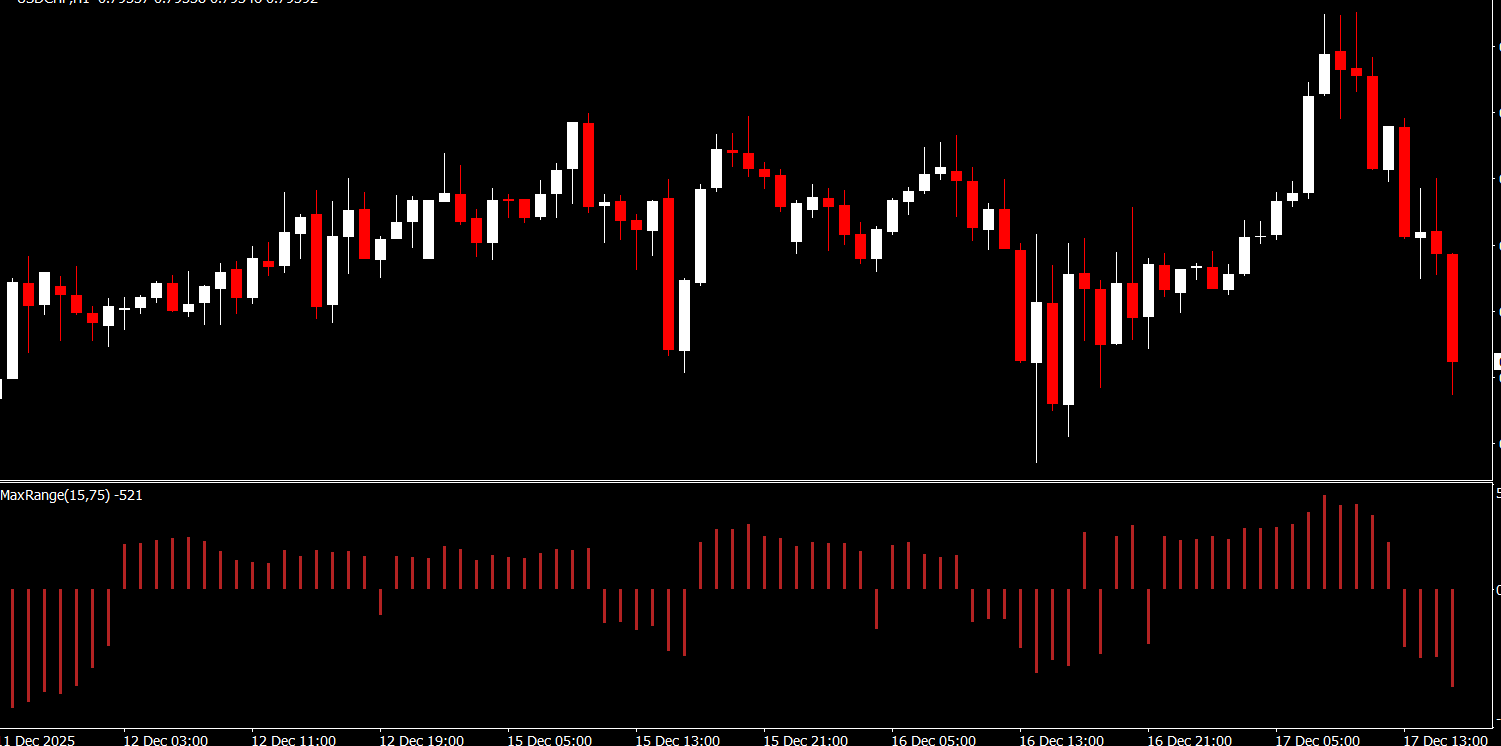
The Max Range Bars Indicator plots a single bar for each price candle, where the bar length is determined by the maximum pip range of that candle. Instead of emphasizing time, the indicator highlights how much price actually moved.
Key components of the indicator include:
Range-based bars that reflect real price movement
A histogram that compares the current candle range to the previous one
Clear visualization of volatility changes
This structure makes the indicator especially useful for traders who want to focus on price behavior rather than time intervals.
How the Max Range Bars Indicator Works
The Max Range Bars Indicator analyzes each candle and measures its maximum pip range. Based on this range, it plots a bar that visually represents how volatile that candle was.
Range-Based Bar Calculation
Large bars indicate strong price movement and high volatility
Small bars indicate weak movement and low volatility
This allows traders to quickly assess whether the market is suitable for active trading or better avoided.
Histogram Comparison
In addition to the bars, the indicator includes a histogram that displays the difference between the current candle’s range and the previous candle’s range. This feature is extremely helpful for identifying sudden changes in volatility.
Rising histogram values may signal increasing momentum
Falling histogram values may signal decreasing volatility
Identifying High and Low Volatility Periods
One of the primary uses of the Max Range Bars Indicator is spotting volatility conditions.
High Volatility Markets
When the bars and histogram increase in size, it often indicates:
Strong momentum
Increased trading opportunities
Potential breakouts
These conditions are ideal for breakout traders and momentum-based strategies.
Low Volatility Markets
Smaller bars suggest:
Ranging or consolidating markets level
Reduced trading opportunities
Higher risk of false signals
During these periods, traders may choose to wait for clearer setups or switch to range-based strategies.
Using the Indicator to Spot Breakouts
Volatility often expands before or during breakouts, and the Max Range Bars Indicator makes this easy to see.
A sudden increase in bar size near key support or resistance levels may confirm a breakout
Rising histogram values can validate the strength of the move
This helps traders avoid false breakouts and focus on moves supported by strong price activity.
Detecting Trend Reversals
The histogram feature of the Max Range Bars Indicator can also help identify potential trend reversals.
Decreasing volatility after a strong trend may signal trend exhaustion
Sharp changes in bar size can warn of momentum shifts
When combined with Price Action or trend indicators, this can provide early reversal signals.
Best Trading Styles and Timeframes
The Max Range Bars Indicator is versatile and works across all timeframes:
Scalping on lower timeframes to filter low-volatility periods
Day trading to confirm momentum and breakout strength
Swing trading to assess trend quality and continuation
It is particularly effective in volatile sessions such as the London and New York market hours.
Advantages of the Max Range Bars Indicator
The Max Range Bars Indicator offers several benefits to Forex traders:
Clear visualization of market volatility
Easy identification of active and quiet markets
Helpful histogram for momentum comparison
Supports breakout and reversal strategies
Free and easy to use on MT4
Its simplicity makes it suitable for beginners, while its analytical depth appeals to advanced traders.
How to Use It with Other Indicators
For best results, the Max Range Bars Indicator can be combined with:
Trend indicators such as moving averages
Support And Resistance levels
Momentum indicators like RSI or MACD
This combination improves confirmation and reduces the likelihood of false signals.
Final Thoughts
The Max Range Bars Indicator is an excellent volatility-based tool for Forex traders who want to better understand market activity. By focusing on price range instead of time, it provides a clearer picture of momentum, volatility, and potential trading opportunities.
If you want to improve your ability to spot high-probability breakouts and avoid low-quality market conditions, this indicator is a valuable addition to your MT4 trading setup. Visit IndicatorForest.com to explore more free Forex indicators and enhance your trading strategy today.
FAQ
Max Range Bars identifies the maximum price range bars on your chart, helping traders spot periods of high volatility and significant price movement. It highlights bars that represent the largest trading ranges within a specified period.
Use max range bars to identify high volatility periods, spot significant price movements, identify potential support/resistance levels at range extremes, and plan trades around expected volatility expansions.
A max range bar indicates strong buying or selling pressure, high volatility, potential trend acceleration, or significant market events. These bars often mark important price levels that may act as support or resistance.
Use range extremes as support/resistance levels, trade breakouts from max range bars, use them for stop-loss placement, and combine with other indicators to confirm trading opportunities around these significant bars.
It works on all timeframes but is particularly useful on H1, H4, and Daily charts where range bars represent more significant price movements. Lower timeframes may show too many max range bars.
1 Download
Published:
Dec 17, 2025 10:56 AM
Category: