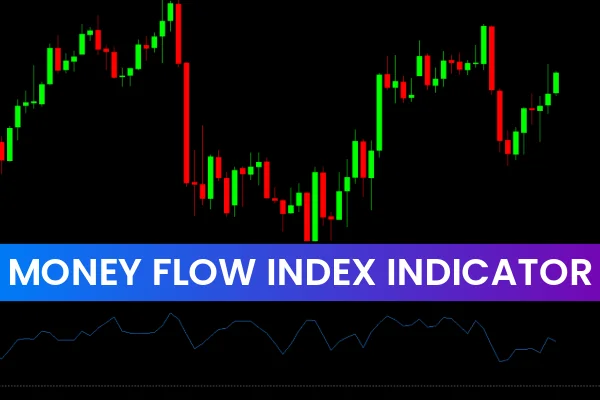
The Money Flow Index Indicator for MT4 is a powerful oscillator that tracks the flow of money into and out of a trading instrument. By incorporating trading volume into its calculation, it provides insight into the strength of market trends. The MFI indicator resembles the Relative Strength Index (RSI) but adds a volume dimension, producing overbought, oversold, and divergence/convergence signals. Both beginner and advanced traders can use this indicator to improve decision-making in Forex trading.
MFI Indicator Setup for MT4
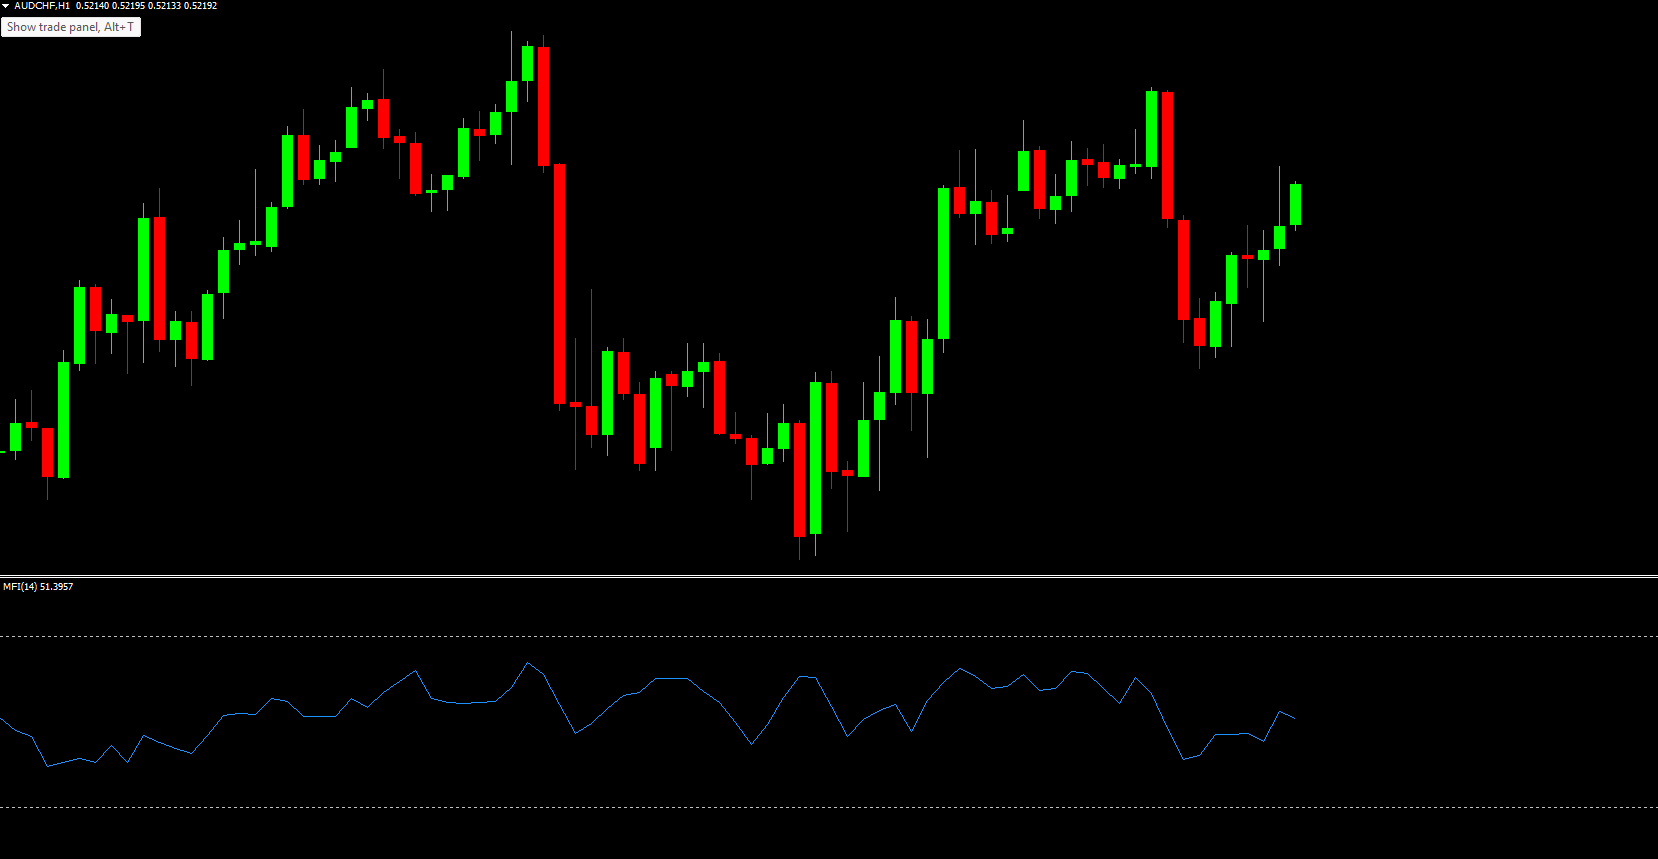
The MFI is displayed as a blue line oscillator in a separate window below the price chart. It includes two horizontal levels:
80 level: Overbought
20 level: Oversold
Traders interpret the MFI similarly to other oscillators:
Values above 80 indicate a potential reversal to the downside (bearish signal)
Values below 20 indicate a potential reversal to the upside (bullish signal)
How to Trade Using Overbought and Oversold Levels
Buy Strategy
Wait for the MFI to fall below the 20 level (oversold condition).
Confirm bullish Price Action.
Enter a BUY position with a stop loss below the recent swing low.
Take profit when the MFI approaches overbought conditions or reverses.
Sell Strategy
Wait for the MFI to rise above the 80 level (overbought condition).
Confirm bearish price action.
Enter a SELL position with a stop loss above the recent swing high.
Take profit when the MFI approaches oversold levels or reverses.
Trading Divergence and Convergence
Divergence and convergence between the MFI and price provide advanced trading signals:
Bearish Divergence: Price makes higher highs while MFI makes lower highs. Suggests potential reversal from bullish to bearish.
Bullish Divergence: Price makes lower lows while MFI makes higher lows. Suggests potential reversal from bearish to bullish.
Divergence signals often coincide with price peaks and valleys, allowing traders to time entries more effectively.
Best Timeframes and Applications
The MFI works well on all intraday, daily, weekly, and monthly charts. For best results:
Combine MFI signals with price action, support/resistance levels, and trend lines
Use with other indicators such as RSI or MACD for confirmation
Avoid trading solely on MFI, as reversal signals can produce false results without confirmation
Advantages of the Money Flow Index Indicator
Combines price and volume analysis for stronger insights
Provides overbought/oversold signals for beginners
Divergence/convergence analysis for advanced traders
Works across multiple timeframes
Easy to install and use on MT4
Key Consideration
While the MFI provides useful signals, it does not guarantee accurate predictions. Always confirm signals with other technical tools and market context to avoid false entries.
Conclusion
The Money Flow Index Indicator for MT4 is a versatile oscillator that allows Forex traders to track market momentum and anticipate reversals. By using overbought/oversold conditions and divergence/convergence patterns in combination with price action, traders can make more informed decisions. For best results, pair MFI with other technical indicators, trend lines, and support/resistance analysis. Download the MFI indicator for free and integrate it into your MT4 trading strategy for improved market insights.
FAQ
The Money Flow Index (MFI) measures buying and selling pressure by analyzing both price and volume. It combines price movement with volume data to identify overbought and oversold conditions, helping traders understand whether money is flowing into or out of the market and providing insights into trend strength and potential reversals.
When MFI rises above 80, it typically indicates overbought conditions and potential downward reversal or sell opportunities. When MFI falls below 20, it suggests oversold conditions and potential upward reversal or buy opportunities. These levels help identify potential turning points in the market.
MFI incorporates volume data along with price, making it a volume-weighted version of RSI. This provides more reliable signals because it shows whether moves are supported by strong participation. MFI is particularly useful in trending markets where volume confirmation adds significant value to momentum analysis.
Use MFI to identify momentum conditions and potential reversals. Enter long trades when MFI moves out of oversold territory (below 20) and turns upward, and enter short trades when MFI moves out of overbought territory (above 80) and turns downward. Always confirm with price action or trend indicators for better accuracy.
Yes, Money Flow Index works on all MT4 timeframes and currency pairs. It is suitable for scalping, day trading, and swing trading, though many traders find it most effective on H1 and H4 charts where volume patterns are clearer and momentum signals are more reliable.
Published:
Dec 13, 2025 22:26 PM
Category: