Precision Trend Engineering: The Moving Average Demarks Approaches Indicator
In the toolbox of technical analysis, moving averages are ubiquitous for smoothing out price fluctuations and laying bare the underlying direction of a market. Yet standard moving average metrics frequently suffer from structural lag, exposing traders to delayed entries and whipsaws during rapid market turns. To solve this dilemma, quantitative traders study the intersections of moving average models built around structural trend lines and algorithmic exhaustions. The Moving Average Demarks Approaches Indicator addresses this core challenge, fusing adaptive line calculation with clear structural boundaries to maximize your trend accuracy.
Here is a breakdown of how this analytical indicator works and how to integrate it into your active trading routine.
Combining Smoothing with Structural Architecture
Traditional technical systems rely on simple historical closes to formulate their data paths. The Moving Average Demarks Approaches Indicator introduces a more comprehensive approach. By processing price velocity alongside specific structural markers, the underlying math creates a trend line that is highly adaptive to live liquidity changes.
Rather than running as a static mathematical line that ignores intra-candle extremes, this indicator constantly updates its trailing vector. This allows the smooth red line to conform directly to immediate institutional expansion phases without incorporating the destabilizing noise that causes regular short-period averages to deliver false breakouts.
Analyzing the Multi-Timeframe Trend Incline
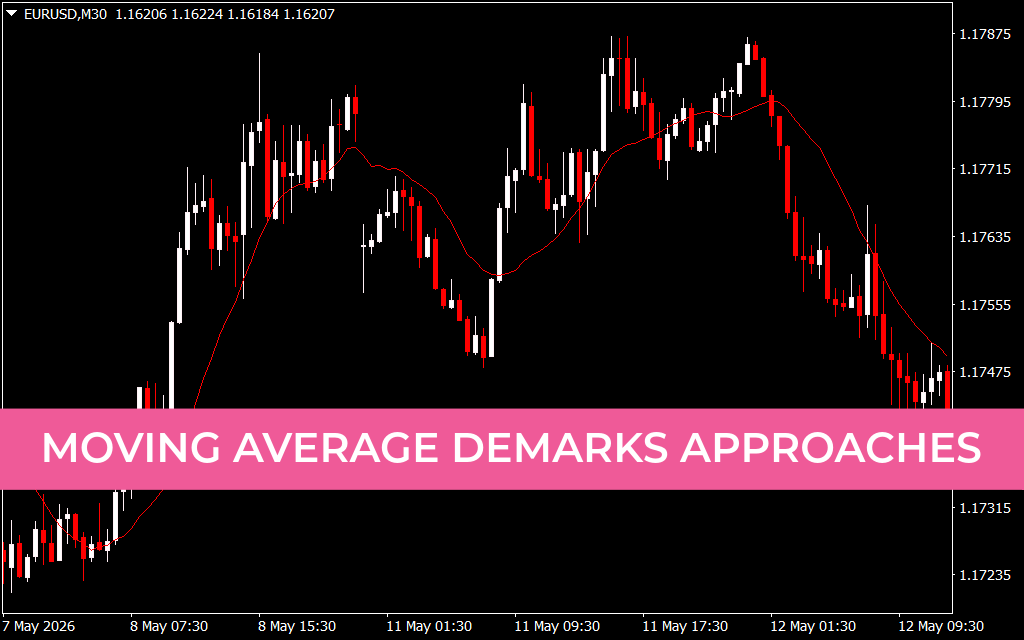
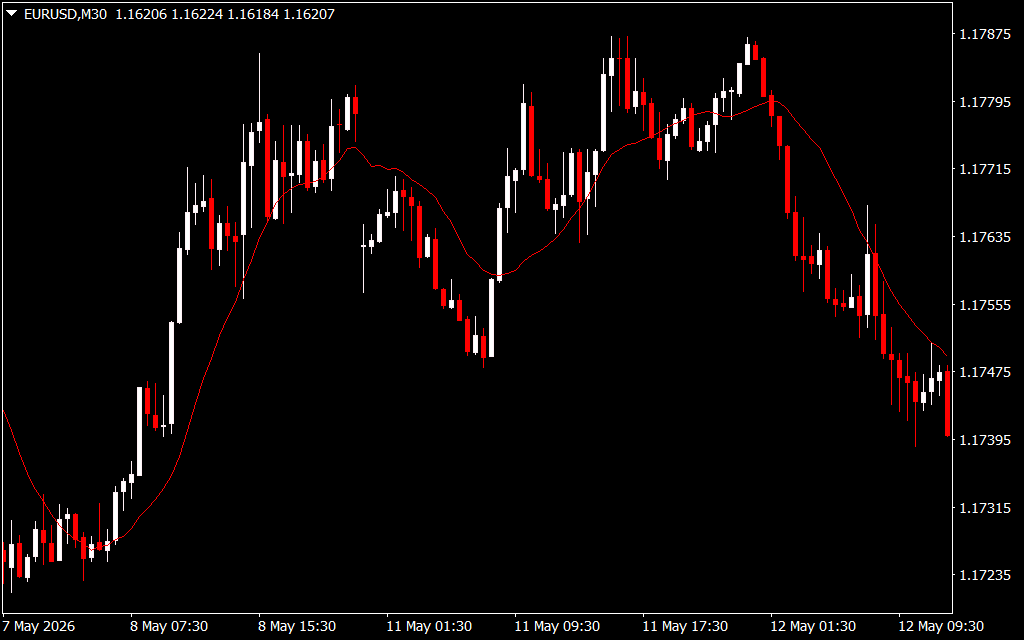
As demonstrated across the provided EUR/USD chart setups—spanning the M5, M30, and broader multi-timeframe horizons—the indicator maps a clear path of Trend Continuation and dynamic defense:
- Intraday Structural Tracking (M5 Chart): On the lower execution timeframes, the smooth red line cuts cleanly through the short-term fluctuations. When the candles trade comfortably above a rising red line, it signals that buyers are successfully defending localized pullbacks.
- Macro Regime Horizon (M30 Chart): When tracking the 30-minute chart, the indicator maps out comprehensive macroeconomic shifts. A long, cascading descent in the line provides objective confirmation of institutional distribution, capping the peak of corrective counter-trend rallies.
When Price Action stays firmly below a downward-sloping indicator line, it offers clear technical evidence that the path of least resistance remains lower, signaling traders to look for sell opportunities.
Professional Strategies for Chart Implementation
To extract maximum structural edge from the Moving Average Demarks Approaches system, integrate these systematic trading principles:
- Directional Convergence Filters: Use a dual-timeframe process to clean up your entries. Look at the slope of the indicator line on the M30 chart to determine your primary trend bias for the session. If the macro line is sloping downward, drop to the M5 chart and only take short entries when the lower-timeframe line turns bearish.
- Dynamic Trap Management: During horizontal market consolidations, price candles will crisscross the indicator line frequently. Identify these low-volume traps when the line sits completely flat, and wait for a decisive candlestick breakout accompanied by a clear incline in the line before entering.
- Logical Risk Mitigation: Use the dynamic path of the line to establish a rule-based trailing stop. If you are riding a short swing trade, place your defensive stop order a few pips behind the descending red line, dragging it lower to secure accumulated equity seamlessly.
2 Downloads
Last Update:
May 17, 2026 02:05 AM
Published:
Jan 20, 2026 22:48 PM
Category: