Mastering Market Structure: Trading Volume Profiles with the MP Overlay Indicator
Understanding where the smart money is accumulating and distributing assets is the ultimate edge in forex trading. While standard price charts show what happened and when, they completely hide the critical component of volume distribution across specific price levels. The MP Overlay Indicator for MT4/MT5 solves this structural blind spot by projecting a highly accurate, dynamic Market Profile and volume overlay directly onto your chart, allowing day traders and scalpers to pinpoint high-probability institutional zones.
Deciphering the Volume Profile on EUR/USD M30
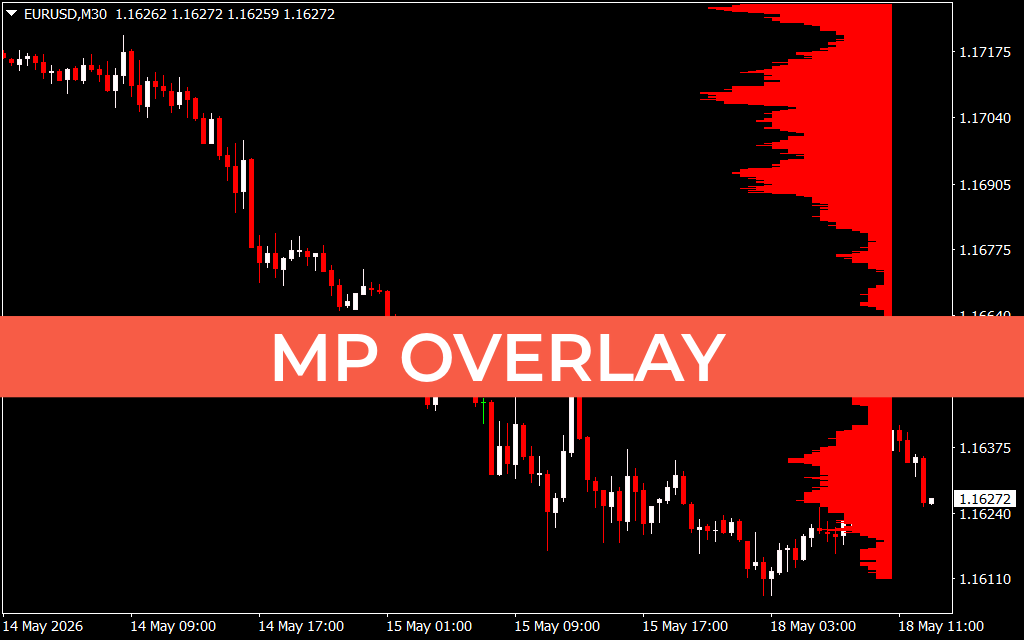
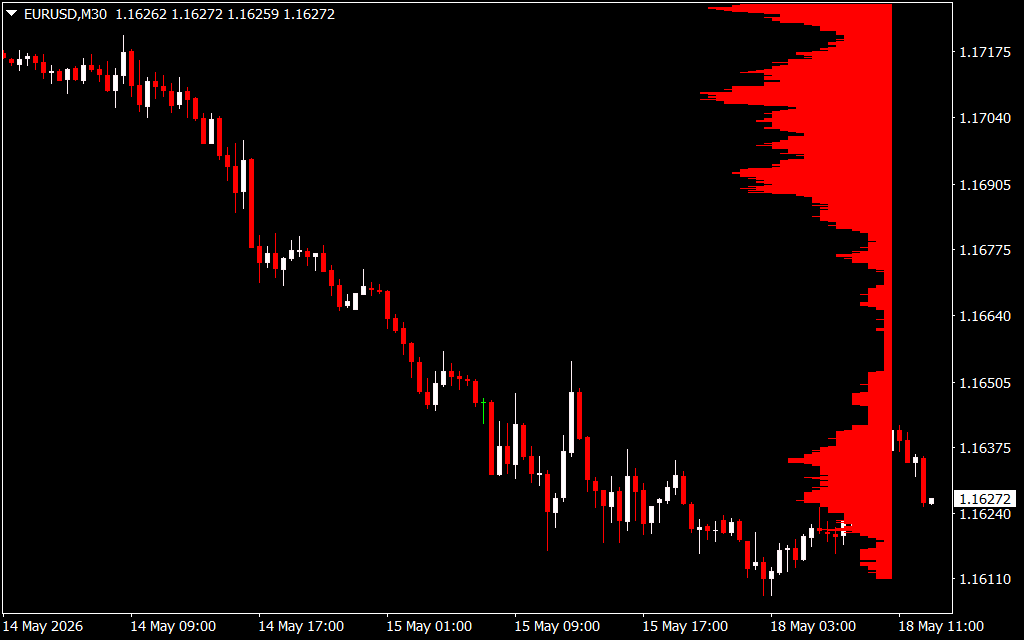
In the provided EUR/USD 30-minute chart, the MP Overlay perfectly visualizes the structural distribution of trading activity across a multi-day bearish descent and subsequent consolidation.
During the aggressive markdown phase starting on May 14, the price sliced through overhead levels with high velocity. Looking at the MP Overlay on the right side of the chart, notice how the red volume bars are relatively thin in the middle of the drop (around the 1.1660 to 1.1690 area). This indicates low-volume nodes—zones where price moved too fast for significant institutional building to occur. In future trading sessions, these low-volume areas typically act as "liquidity vacuums," meaning price can easily slice right back through them when a retracement occurs.
Conversely, as the trend matured on May 15 and transitioned into May 18, a massive high-volume node (HVN) began to develop near the bottom of the range, specifically around the 1.16240 to 1.16375 region. This dense cluster of red horizontal bars highlights intense institutional cross-matching. Buyers are absorbing the selling pressure, establishing a firm value area.
Trading Strategic Pivots and Value Areas
The MP Overlay turns standard candlesticks into actionable execution zones by clearly displaying the Point of Control (POC)—the price level where the most trading activity occurred.
As the EUR/USD pair establishes a base near 1.16110 and attempts to reverse upward into May 18, it is currently trading at 1.16272, directly inside this major high-volume accumulation node. For a technical trader, this volume block acts as a powerful structural anchor. As long as the price sustains acceptance within or above this lower volume cluster, it signals that institutional accumulation is complete, setting the stage for a bullish breakout toward the next overhead high-volume nodes.
By integrating the MP Overlay into your daily technical analysis, you stop guessing where Support And Resistance might form. Instead, you trade the objective reality of market volume, aligning your entries perfectly with institutional order flow.
1 Download
Last Update:
May 18, 2026 16:02 PM
Published:
Jan 20, 2026 15:44 PM
Category: