Master Market Structure with the MP Overlay Indicator
In the complex world of technical analysis, Price Action and volume are the two most critical data points for any successful trader. However, standard charts often fail to show where the "real" value of an asset lies. The MP Overlay Indicator (Market Profile Overlay) is a professional-grade tool designed to reveal the internal structure of the market by organizing price data into a horizontal volume distribution. This allows you to see exactly where the most significant trading activity has occurred, helping you identify high-probability reversal zones and breakout targets.
Visualizing Value: The TPO and Volume Profile
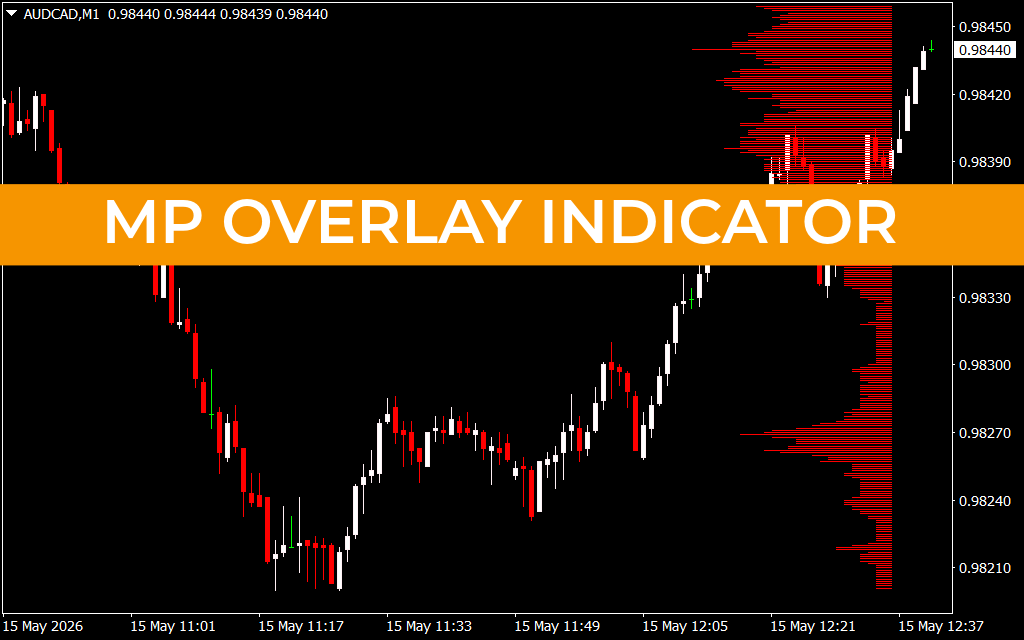
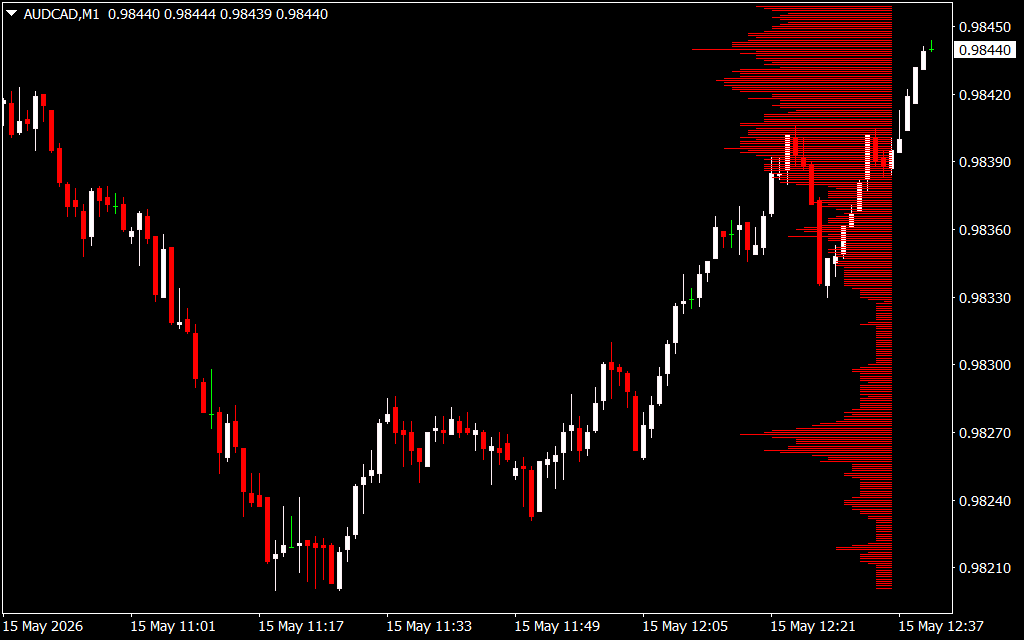
The MP Overlay Indicator functions by plotting a horizontal histogram on your chart, often referred to as a Time Price Opportunity (TPO) or Volume Profile. Unlike a standard vertical volume bar that shows activity over a specific time period, the MP Overlay shows activity at specific price levels.
As seen in the AUD/CAD M1 chart, the indicator projects horizontal red bars on the right side of the screen.
- The Point of Control (POC): This is the longest horizontal bar, representing the price level where the highest volume of trading occurred during a specific session.
- Value Area (VA): This represents the range of prices where a majority (typically 70%) of the trading activity took place.
- High/Low Volume Nodes: These peaks and valleys in the histogram identify where price is likely to find support or "slice through" with high velocity.
Strategic Trading with Market Profile
The MP Overlay is a favorite among institutional traders because it highlights "fair value." When price is trading within the Value Area, the market is in equilibrium. However, when price moves outside of this zone, a major trend is often underway.
- Trading the POC: The Point of Control acts as a powerful magnet for price. If price deviates significantly from the POC, it often returns to "retest" this level of high liquidity.
- Breakout Confirmation: If price breaks out of the Value Area High or Low on heavy volume, it signifies a shift in market sentiment. Traders use the MP Overlay to ensure they are entering trades where the "smart money" is actively participating.
- Support And Resistance: Low Volume Nodes (the "valleys" in the histogram) act as rejection zones. Because very little trading occurred at these levels, price tends to bounce off them or move through them very quickly.
Precision for Day Traders and Scalpers
For traders operating on lower timeframes like the M1 or M5, the MP Overlay is indispensable for identifying "intraday magnets." In the AUD/CAD example, the indicator clearly displays how price interacts with the previous session's high-volume nodes. By understanding where the market has previously agreed on a "fair price," you can avoid buying at the top of a range or selling at the bottom.
Why You Need the MP Overlay Indicator
Standard indicators like Moving Averages are lagging; they tell you what happened in the past. The MP Overlay Indicator is a leading tool that shows you where the orders are currently sitting. It provides a multidimensional view of Market Structure that turns a flat chart into a map of institutional intent. Whether you are a Forex scalper or a long-term swing trader, the MP Overlay gives you the clarity needed to trade with the flow of the market rather than against it.
1 Download
Last Update:
May 15, 2026 15:43 PM
Published:
Jan 21, 2026 20:35 PM
Category: