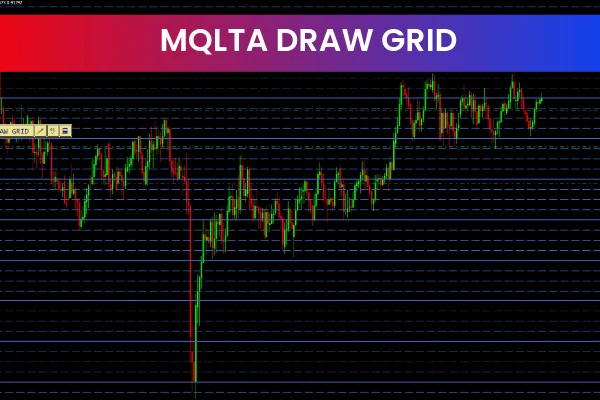
The MQLTA Draw Grid Indicator is a free and popular Forex Indicator for the MT4 trading platform. This tool helps traders visualize key support and resistance levels by drawing a customizable grid directly on their chart. By highlighting important price zones, the indicator allows traders to make better-informed entry and exit decisions.

Suitable for traders of all levels, the MQLTA Draw Grid Indicator simplifies chart analysis and provides a clear visual framework for trading.
How the MQLTA Draw Grid Indicator Works
The MQLTA Draw Grid Indicator plots a grid on the chart based on your chosen settings. Each line of the grid represents a potential support or resistance level, allowing traders to anticipate market reactions at key price points.
The indicator also displays the current price level, which helps in identifying precise entry and exit points. Traders can adjust the grid spacing, color, and line width to match their trading style and chart preferences.
Key Features of the MQLTA Draw Grid Indicator
The MQLTA Draw Grid Indicator offers several features that make it an essential tool for Forex traders.
Support and Resistance Identification
The primary function of the indicator is to mark important Support And Resistance zones. These levels are crucial for predicting price reactions, trend reversals, and breakout points.
Customizable Grid
Traders can adjust the grid size, line color, and line width to fit their trading style. This flexibility ensures the grid is clear, visually appealing, and suited to any chart setup.
Current Price Display
The indicator also shows the current price on the chart, making it easier to compare market levels with the drawn grid lines. This feature aids in planning trades and managing positions.
How the MQLTA Draw Grid Indicator Can Benefit You
Using the MQLTA Draw Grid Indicator helps traders visualize key price zones and improves market awareness. It makes it easier to identify potential reversals, breakout points, and profitable trade setups.
The indicator is effective across all timeframes and currency pairs, making it a versatile tool for day trading, swing trading, or long-term trading strategies. By combining the grid with other indicators, such as oscillators or moving averages, traders can increase the accuracy of their entries and exits.
Best Practices for Using the Indicator
Adjust the grid spacing to suit your preferred timeframe
Use grid lines to identify potential buy or sell zones
Combine the indicator with support/resistance analysis, trendlines, or oscillators
Monitor price reactions around grid levels to anticipate breakouts or reversals
Why Use Indicators from IndicatorForest.com
At IndicatorForest.com, traders can access high-quality MT4 indicators like the MQLTA Draw Grid Indicator. These tools are designed to simplify trading, highlight high-probability setups, and improve overall trading performance.
Visit IndicatorForest.com to explore free Forex indicators, professional MT4 tools, and expert resources for smarter trading decisions.
Published:
Dec 29, 2025 13:20 PM
Category: