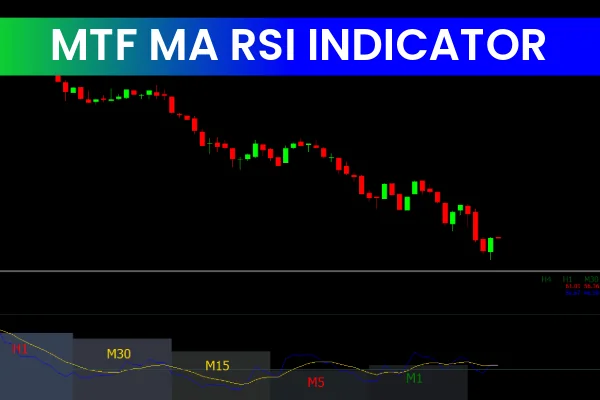
The MTF MA RSI indicator for MT4 is a multi-timeframe trading tool that combines the classic Relative Strength Index (RSI) with its moving average. Unlike standard RSI indicators, the MTF MA RSI displays the RSI and MA values for multiple timeframes, including H4, H1, M30, M15, M5, and M1, all within a single window.
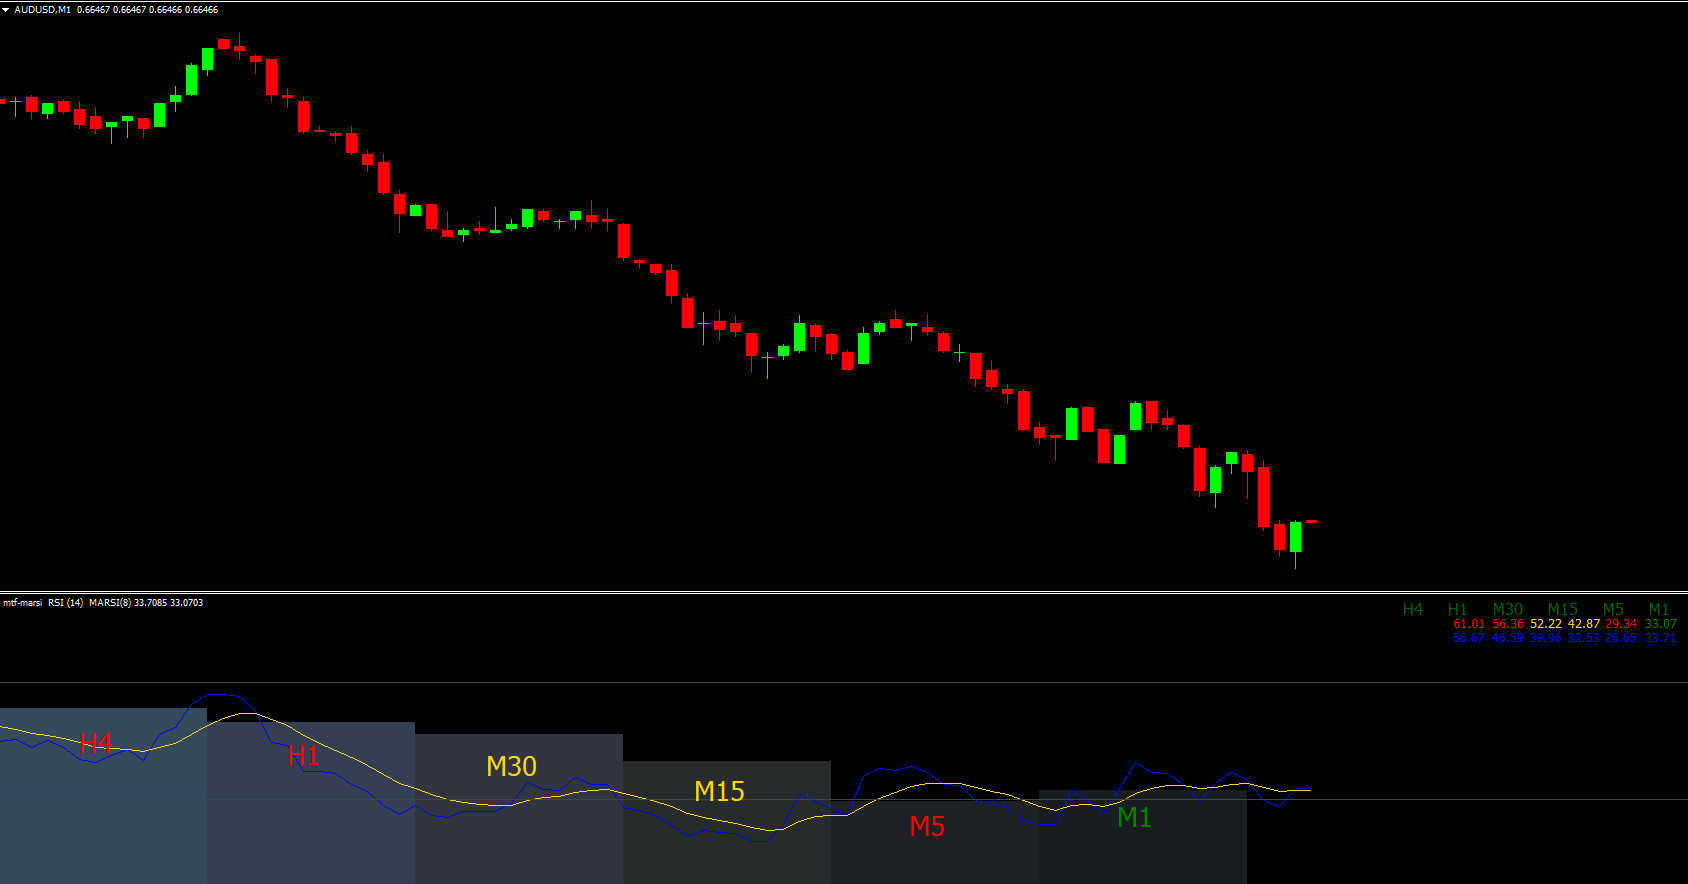
This feature enables traders to quickly visualize market trends across all relevant timeframes at a glance, making it easier to align short-term trades with the broader market trend. Whether you are a beginner or an advanced forex trader, the MTF MA RSI indicator simplifies decision-making by consolidating key data.
How the Indicator Works
The indicator provides two main visual components:
Upper Row: MARSI values across multiple timeframes
Lower Row: Classic RSI values for each timeframe
The RSI line is typically displayed in yellow, while the MA of RSI appears in blue. The core trading strategy is based on crossovers between these lines, signaling potential bullish or bearish trades.
Why the MTF MA RSI Indicator Is Valuable
The MTF MA RSI indicator is highly versatile and works on all intraday charts as well as daily, weekly, and monthly charts. Its key benefits include:
Multi-Timeframe Analysis: View multiple RSI signals at a glance without switching charts
Trend Confirmation: Align trades with the dominant market direction
Ease of Use: Ideal for both new and advanced traders
Clear Trade Signals: Bullish and bearish signals are easily identifiable via crossovers
How to Trade Using the MTF MA RSI Indicator
Buy Signal
A bullish trade is indicated when:
The RSI line crosses above the MA RSI line
Confirms upward momentum across the selected timeframe
Stop-loss: placed below the previous swing low
Exit strategy: either on an opposite crossover or based on a favorable risk-to-reward ratio
Sell Signal
A bearish trade is indicated when:
The RSI line crosses below the MA RSI line
Confirms downward momentum
Stop-loss: placed above the previous swing high
Exit strategy: either on a bullish crossover or at key support levels
Strategy Tips
Check overall trend direction on higher timeframes before taking trades
Use the indicator in combination with support/resistance zones for better confirmation
Consider using it alongside other trend-following or momentum indicators for enhanced accuracy
Advantages of the MTF MA RSI Indicator
The MTF MA RSI indicator stands out because it combines:
Efficiency: Multiple timeframes in a single window reduce the need for switching charts
Accuracy: Blue MA line smooths RSI fluctuations, reducing false signals
Versatility: Suitable for Scalping, intraday, swing trading, and long-term analysis
User-Friendly Design: Easy-to-read color-coded lines make decision-making faster
This makes the MTF MA RSI indicator an essential tool for traders who want to capture trend opportunities across different timeframes while maintaining clarity and control.
Conclusion
The MTF MA RSI indicator for MT4 is a multi-timeframe, RSI-based indicator that simplifies market analysis by showing RSI and MA values for several chart intervals simultaneously. It provides clear trade signals based on line crossovers while helping traders align with broader market trends. To access more advanced MT4 indicators and trading tools, visit IndicatorForest.com and improve your forex trading strategy today.
FAQ
Published:
Dec 10, 2025 22:15 PM
Category: