The Multi Range Calculator for MT4 is an essential forex trading indicator designed to provide traders with detailed insights into historical price movements. By analyzing multiple price ranges, this tool helps traders make more informed decisions by understanding how a financial instrument has moved over various periods.
What is the Multi Range Calculator for MT4?
The Multi Range Calculator is a sophisticated tool for MetaTrader 4 that calculates and displays key technical information for a trading instrument. It offers insights into past price ranges, including 1-day, 5-day, 10-day, 20-day, and daily movements. The indicator also automatically suggests recommended stop loss levels for your trades, improving risk management.
By visualizing these ranges on your chart, the Multi Range Calculator helps traders identify potential Support And Resistance zones, understand market volatility, and refine trading strategies.
How to Use the Multi Range Calculator for MT4
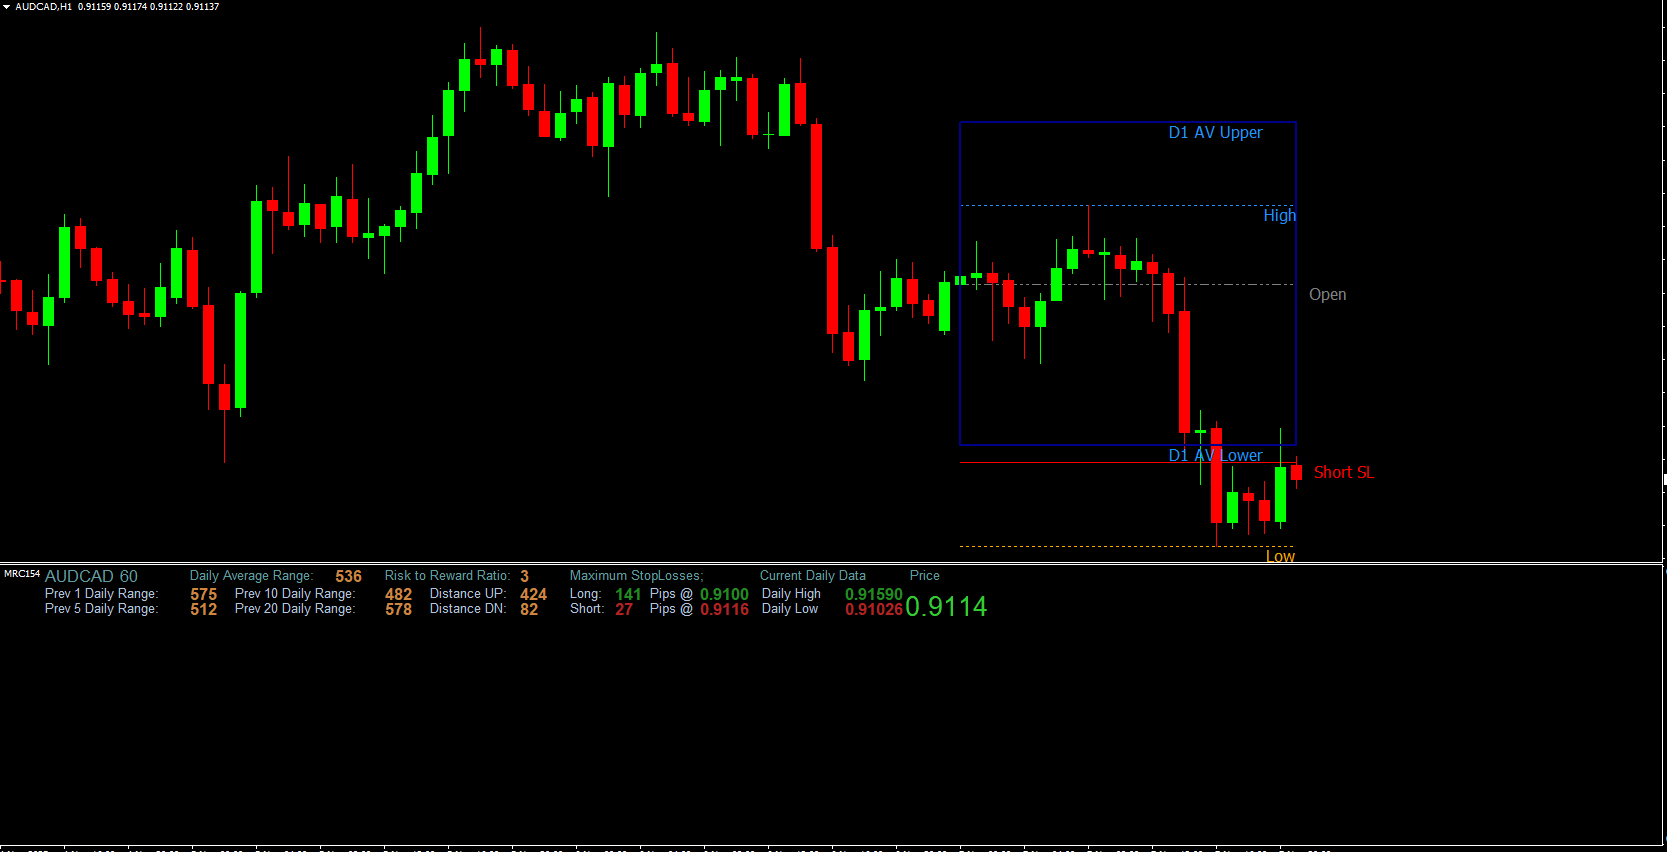
Using the Multi Range Calculator is straightforward. Once installed on MetaTrader 4, the indicator overlays essential information directly on your trading chart:
Red and Green Lines: These horizontal lines represent the suggested stop loss for sell and buy positions, respectively.
Price Range Window: Below the main chart, a separate window displays calculated price ranges for the selected periods.
It’s important to note that the Multi Range Calculator should not be used as a standalone tool to enter trades. Instead, it should complement your technical analysis to provide additional context on market behavior.
Benefits of the Multi Range Calculator
Improved Risk Management: Automatically suggested stop loss levels reduce potential losses.
Historical Analysis: View past price movements to better anticipate future trends.
Easy to Read: Information is displayed clearly, making technical analysis more efficient.
Free to Use: This powerful indicator is available at no cost, making it accessible to all traders.
Tips for Maximizing Effectiveness
To get the most from the Multi Range Calculator for MT4, combine it with other indicators such as moving averages, RSI, or MACD. This holistic approach allows traders to validate entry and exit points with higher accuracy.
Additionally, review multiple time frames to understand how price ranges evolve, which helps in spotting trends or market reversals.
Conclusion
The Multi Range Calculator MT4 is a versatile forex trading indicator that simplifies the analysis of historical price movements and stop loss recommendations. Free to download, it’s an indispensable tool for traders seeking a deeper understanding of market dynamics. For more insights and free trading tools, visit IndicatorForest.com.
FAQ
4 Downloads
Published:
Nov 09, 2025 00:08 AM
Category: