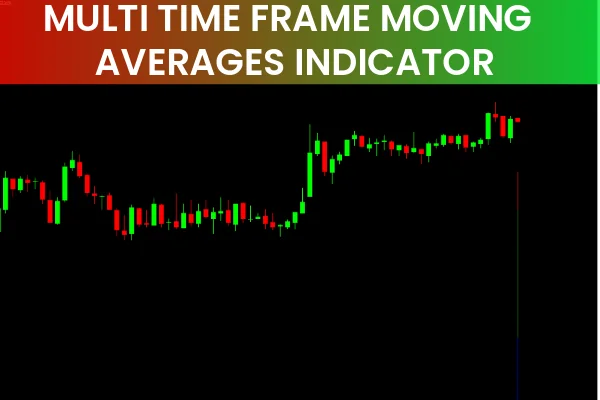
The Multi-Time Frame Moving Average Indicator for MT4 is a versatile tool that allows forex traders to analyze multiple timeframes at once. By plotting moving averages from 30-minute (M30), 1-hour (H1), and 4-hour (H4) charts onto the current chart, traders gain a broader perspective of market trends and can make more informed buy or sell decisions.
How the Multi-Time Frame Moving Average Indicator Works
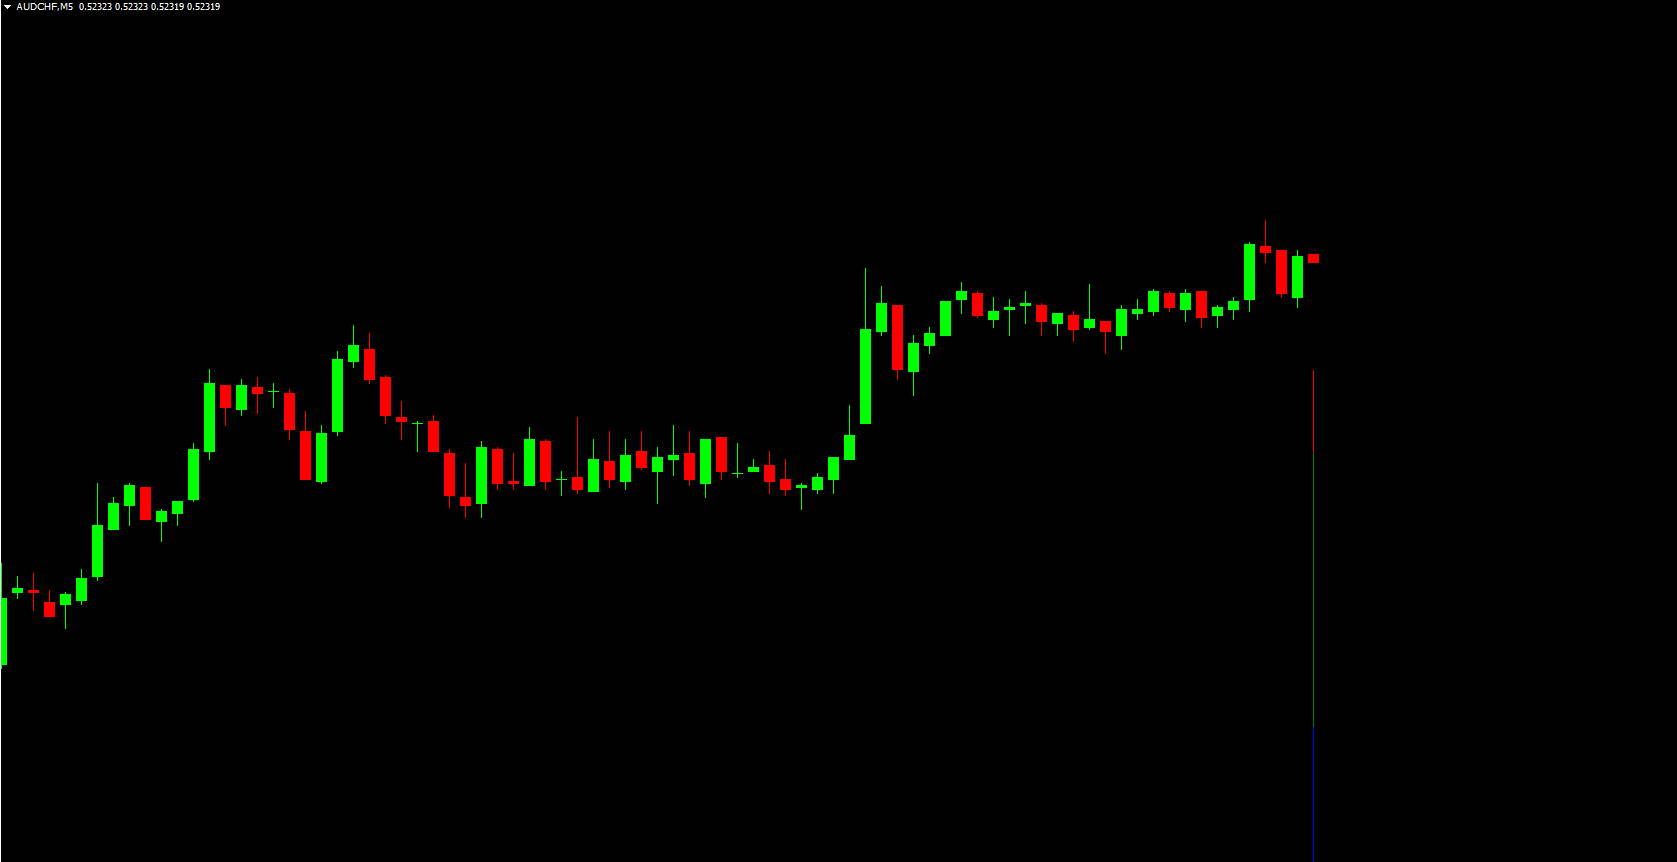
The indicator overlays moving averages of different timeframes directly onto your active chart:
Red line: M30 moving average
Green line: H1 moving average
Blue line: H4 moving average
The primary strategy revolves around crossover signals:
Bullish Signal: When the red and green lines cross above the blue line, it indicates an upward trend. Traders can enter a buy position with a stop loss below the previous swing low.
Bearish Signal: When the red and green lines cross below the blue line, it signals a downward trend. Traders can enter a sell position with a stop loss above the previous swing high.
Traders can ride the trend until an opposite crossover occurs, maximizing potential profit.
Benefits of Using Multi-Time Frame Moving Averages
Clear Trend Visualization: Understand market direction across multiple timeframes at a glance.
No Repainting: Signals remain valid after the candle closes, providing reliable trading information.
Suitable for All Traders: Ideal for beginners and advanced traders alike.
Works Across Timeframes: Compatible with intraday, daily, weekly, and monthly charts.
Improves Decision-Making: Helps identify trend continuations and reversals efficiently.
Trading Tips
Combine with support/resistance levels or other indicators to confirm trade entries.
Use proper risk management with stop-loss and take-profit orders.
Monitor trends on higher timeframes for long-term trades while entering positions on lower timeframe charts for precise entries.
Conclusion
The Multi-Time Frame Moving Average Indicator for MT4 is an essential tool for forex traders who want to view trends across multiple timeframes simultaneously. By using moving average crossovers and analyzing M30, H1, and H4 charts together, traders can make better-informed decisions and maximize trading opportunities. Download the indicator for free from IndicatorForest.com and start analyzing trends more effectively.
FAQ
2 Downloads
Published:
Nov 20, 2025 00:27 AM
Category: