The Multi ZigZag Indicator is a popular and free Forex tool designed for the MetaTrader 4 (MT4) platform. This indicator helps traders identify potential trend reversals and continuations while providing a clear visual representation of market behavior. By highlighting key areas of Support And Resistance, the Multi ZigZag Indicator allows traders to make more informed buy and sell decisions.
How the Multi ZigZag Indicator Works
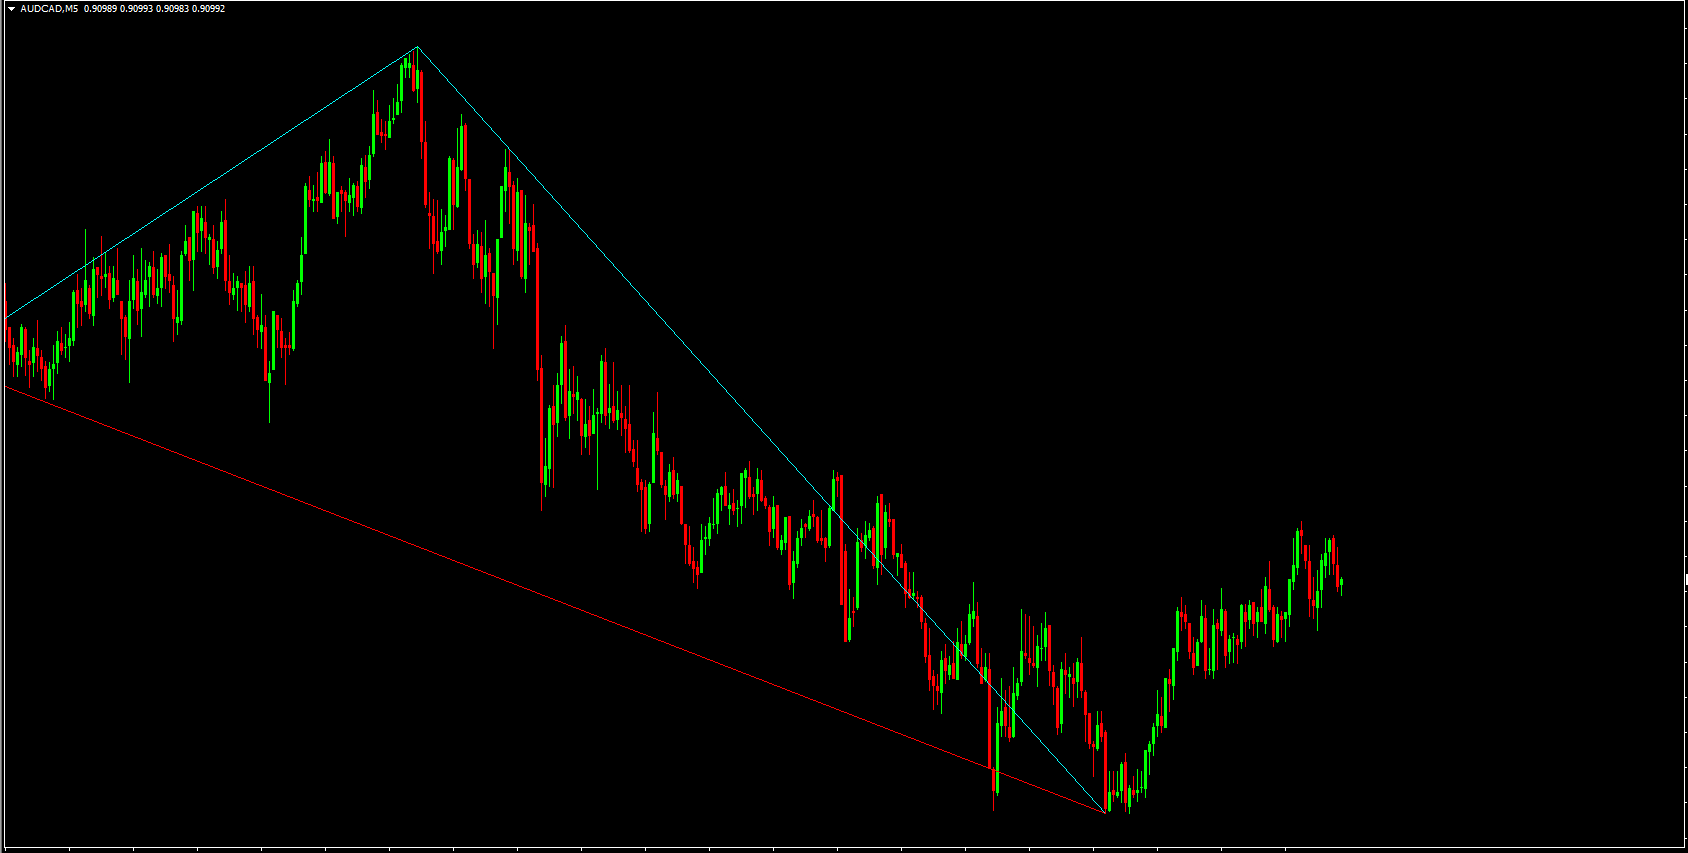
The indicator plots a series of zigzag lines on the MT4 chart based on an oscillator-based algorithm. These zigzag lines reflect the market’s highs and lows, helping traders spot potential trend changes.
In addition to zigzag lines, the indicator can detect trend lines and Fibonacci retracement levels, providing valuable reference points for identifying entry and exit positions. Traders can customize parameters, such as the number of zigzag lines and the lookback period, to fit their trading style.
Key Features of the Multi ZigZag Indicator
Zigzag Line Visualization: Clearly displays highs and lows to indicate trend reversals
Trend Line Detection: Helps traders spot trend directions and potential breakout points
Fibonacci Retracement Levels: Identifies key support and resistance zones for better trade planning
Customizable Parameters: Adjust lines, lookback period, and sensitivity according to trading needs
Free and Easy to Use: Compatible with all MT4 charts and timeframes
Benefits of Using the Multi ZigZag Indicator
Identify Trend Reversals: Quickly spot bullish and bearish turning points in the market
Support and Resistance Levels: Visualize key price zones to improve trade entry and exit accuracy
Enhance Short-Term Trading: Ideal for scalpers and day traders looking to capitalize on intraday movements
Improve Risk Management: Use trend lines and Fibonacci levels to optimize stop loss and take profit strategies
Refine Trading Strategies: Combine with other technical indicators for stronger confirmations
How to Maximize the Indicator’s Potential
Enter buy trades near support areas highlighted by the zigzag or Fibonacci retracement
Enter sell trades near resistance levels or after detecting bearish zigzag reversals
Use trend line detection to confirm Trend Continuation before entering trades
Combine with other tools such as RSI, MACD, or moving averages to validate signals
By incorporating the Multi ZigZag Indicator into your MT4 trading strategy, traders can better understand market dynamics, anticipate trend reversals, and improve overall trading performance.
FAQ
Multi ZigZag plots zigzag lines that connect significant swing highs and lows, making the overall structure of the market clearer. It can also draw trendlines and Fibonacci retracement levels to show important support and resistance areas.
You can look for buy setups near support zones identified by zigzag lows or Fibonacci retracements, and sell setups near resistance formed by zigzag highs. Waiting for confirmation from price action or other indicators can improve reliability.
No. The indicator works on all MT4 timeframes and can be configured to show either more detailed short‑term swings or broader long‑term structure. Swing and position traders often use higher‑timeframe zigzags to plan bigger moves.
Fibonacci retracements drawn from recent swings show where pullbacks might reasonably end before the trend resumes. These levels can be used to place limit orders, stops or profit targets.
Momentum tools like RSI or MACD and basic support/resistance analysis complement zigzag structure well. Using them together helps distinguish between minor retracements and more serious reversals.
8 Downloads
Published:
Dec 18, 2025 03:38 AM
Category: