Achieve Institutional Precision with the Murrey Math All Time Frames Colored Indicator
In the world of professional trading, identifying where price is likely to pause, reverse, or accelerate is the ultimate challenge. While most retail traders rely on lagging indicators, professional analysts often turn to geometric Price Action and fractal mathematics. The Murrey Math All Time Frames Colored Indicator for MetaTrader 4 (MT4) is a sophisticated technical tool that applies these advanced mathematical principles to provide a clear, objective roadmap of Support And Resistance levels across any timeframe.
The Science Behind Murrey Math
Murrey Math is based on the observation that price moves in recurring patterns or "octaves," similar to musical scales. It divides price action into an $8/8$ grid, where each level represents a specific psychological and mathematical milestone. The "All Time Frames Colored" version takes this a step further by color-coding these critical levels, making it instantly readable for fast-paced intraday trading.
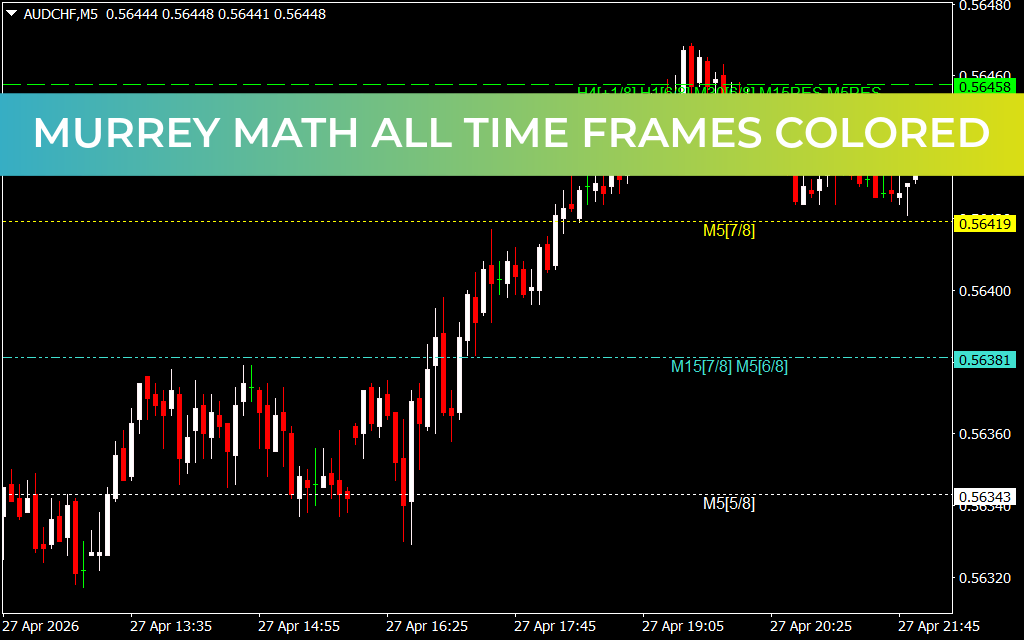
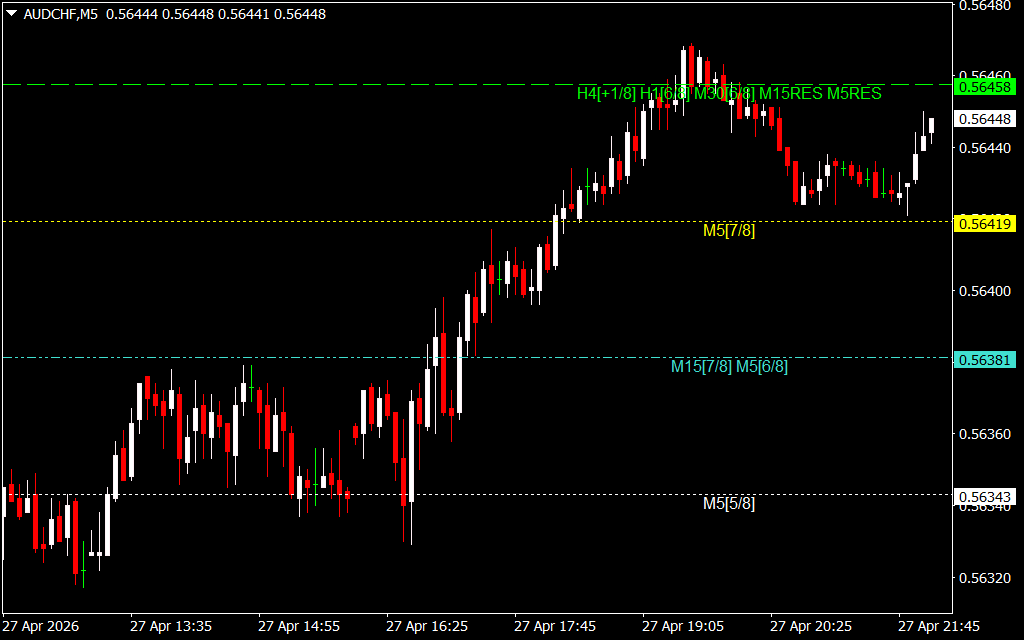
As shown in the provided AUD/CHF M5 chart, the indicator overlays several horizontal lines, each with a distinct meaning:
- The [4/8] Line (Major Support/Resistance): This is the "Center" or equilibrium of the octave. It is the most difficult level for price to break.
- The [0/8] and [8/8] Lines (Ultimate Support/Resistance): These represent the hardest barriers for the market to overcome, often acting as the launchpad for major reversals.
- The [1/8] and [7/8] Lines (Weak Support/Resistance): These levels indicate where price is likely to stall temporarily before continuing its move.
- Multi-Timeframe Integration: The indicator displays levels from higher timeframes (like H1, H4, or Daily) directly on your M5 chart, as seen in the labels (e.g., $H4 [+1/8]$ and $H1 [6/8]$).
Why Professional Traders Use Murrey Math
The Murrey Math All Time Frames Colored Indicator solves the problem of subjective "drawing" of support and resistance.
- Fixed Mathematical Levels: Unlike discretionary trendlines, Murrey Math levels are calculated based on the square of price and time. This provides a consistent "grid" that the market mathematically respects.
- Fractal Clarity: By seeing where a 5-minute move hits a 1-hour or 4-hour Murrey level, you gain an "X-ray" view of the market. You can identify exactly when an intraday trend is running into institutional-grade resistance.
- Color-Coded Psychological Zones: The indicator highlights "Overshot" zones ($+1/8, +2/8$) and "Oversold" zones ($-1/8, -2/8$), signaling when a reversal is highly probable.
Strategic Application: The Octave Reversal
The most effective way to trade with this indicator is the Confluence Breakout strategy.
- The Filter: Identify a higher-timeframe resistance, such as the $H4$ level shown at $0.56458$ on the AUD/CHF chart.
- The Setup: As price approaches this $H4$ level on the M5 timeframe, watch for price action to stall at the M5 $[8/8]$ or $[+1/8]$ lines.
- The Trigger: A rejection or reversal from these mathematical "overextended" levels provides a high-reward, low-risk entry point for a short trade back toward the $[4/8]$ equilibrium.
Conclusion
The Murrey Math All Time Frames Colored Indicator is an indispensable asset for MT4 traders who want to move away from guesswork and toward mathematical certainty. By unifying multi-timeframe analysis into a single, color-coded grid, it provides the structural clarity needed to master modern market movements. Whether you are Scalping the M5 or swing trading the Daily charts, this indicator provides an institutional edge.
9 Downloads
Last Update:
Apr 28, 2026 01:08 AM
Published:
Feb 01, 2026 04:08 AM
Category: