Murrey Math Time Frame Indicator

Murrey Math Time Frame Indicator
Free

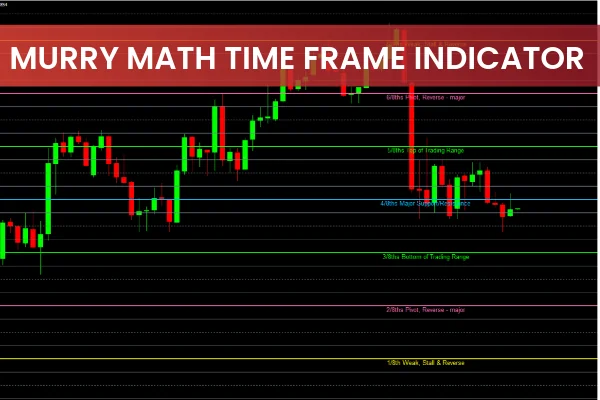
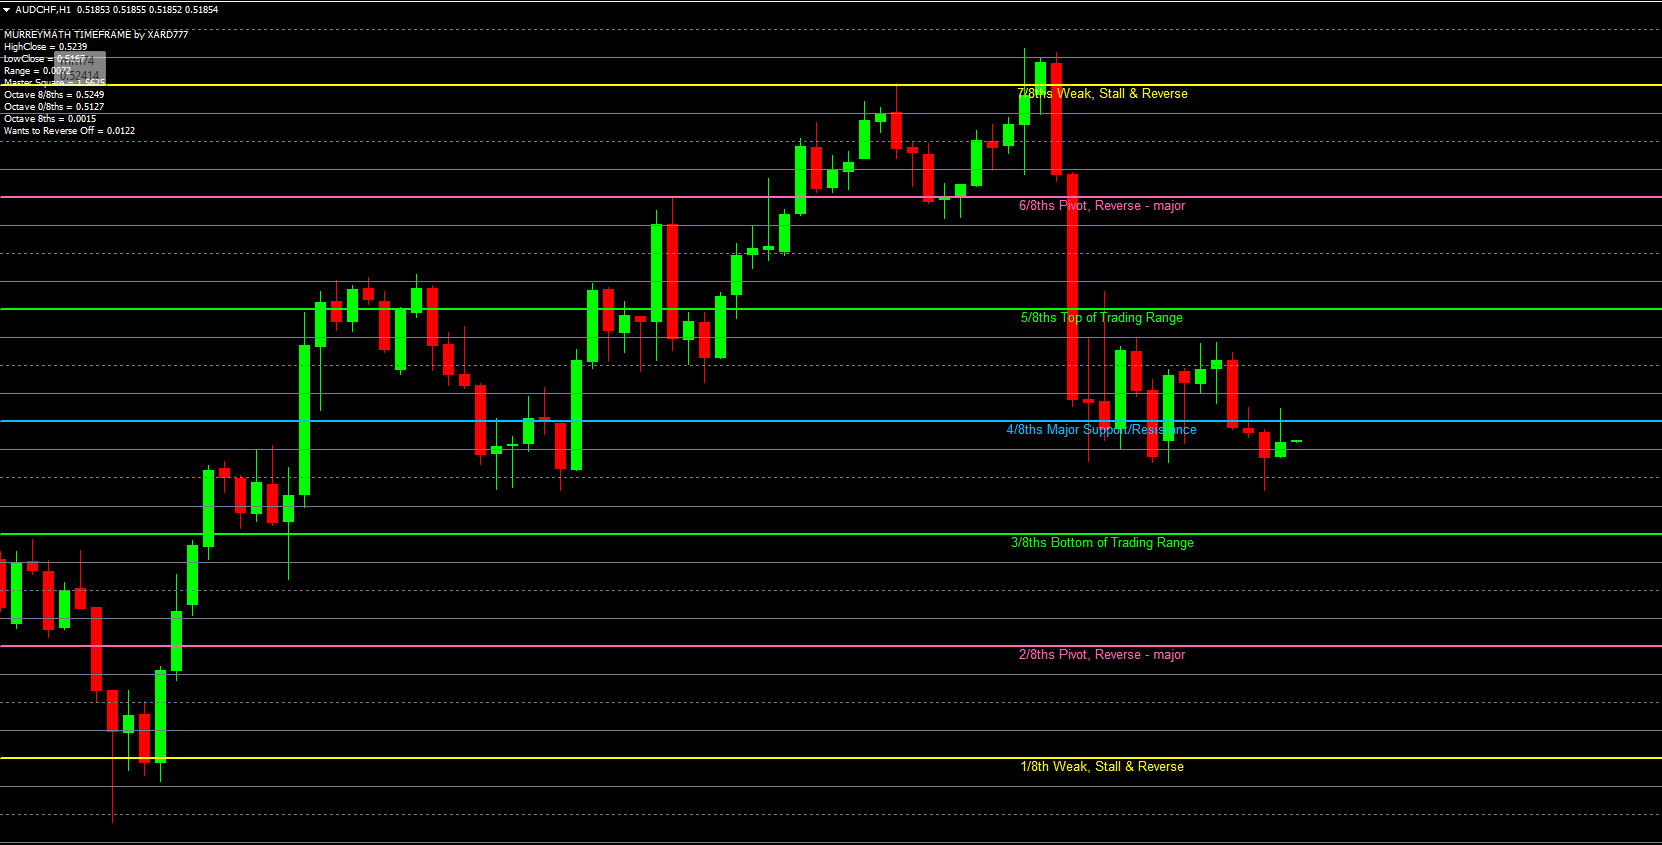
The Murrey Math Time Frame Indicator for MT4 is a technical tool that divides the price chart into eight equal increments, creating nine pivot points ranging from 0/8 to 8/8. These levels provide traders with key Support And Resistance zones, as well as overbought and oversold conditions, enabling precise entry and exit decisions.

Understanding Murrey Math Pivot Points

The nine main pivot points in Murrey Math are as follows:

+2/8 – Extreme Overshoot

+1/8 – Overshoot

8/8 – Ultimate Resistance

7/8 – Weak, Stall, & Reverse

6/8 – Pivot, Reverse – Major

5/8 – Top of Trading Range

4/8 – Major Support/Resistance

3/8 – Bottom of Trading Range

2/8 – Pivot, Reverse – Major

1/8 – Weak, Stall, & Reverse

0/8 – Ultimate Support

-1/8 – Overshoot

-2/8 – Extreme Overshoot

These levels help traders identify where price is likely to reverse or continue, providing a clear framework for trade planning.

Buy or Bullish Signals

When price reaches 0/8 to -2/8, the market is considered oversold.

Traders can anticipate a reversal of a downtrend and look for buy opportunities.

Additional confirmation from other indicators or support/resistance levels improves accuracy.

Sell or Bearish Signals

When price reaches 8/8 to +2/8, the market is considered overbought.

Traders can expect a downward reversal and look for sell opportunities.

Confirm signals using other technical indicators or resistance levels for better timing.

Benefits of the Murrey Math Time Frame Indicator

Provides multiple pivot points for trading across different timeframes

Highlights overbought and oversold conditions for reversal opportunities

Identifies key support and resistance levels for entry and exit points

Complements other technical indicators to improve trade accuracy

Suitable for intraday, swing, and long-term trading strategies

Free to download and easy to install on MT4

Call to Action

Enhance your MT4 trading with the Murrey Math Time Frame Indicator. Download it for free from IndicatorForest.com and start using pivot points to time your buy and sell trades effectively.

FAQ

It divides price into 9 levels from 0/8 to 8/8, creating pivot zones for support/resistance and overbought/oversold conditions.

It divides price into 9 levels from 0/8 to 8/8, creating pivot zones for support/resistance and overbought/oversold conditions.

It divides price into 9 levels from 0/8 to 8/8, creating pivot zones for support/resistance and overbought/oversold conditions.

It divides price into 9 levels from 0/8 to 8/8, creating pivot zones for support/resistance and overbought/oversold conditions.

0/8-2/8 are oversold (buy zones), 8/8-6/8 are overbought (sell zones), 4/8-5/8 are equilibrium areas.

0/8-2/8 are oversold (buy zones), 8/8-6/8 are overbought (sell zones), 4/8-5/8 are equilibrium areas.

0/8-2/8 are oversold (buy zones), 8/8-6/8 are overbought (sell zones), 4/8-5/8 are equilibrium areas.

0/8-2/8 are oversold (buy zones), 8/8-6/8 are overbought (sell zones), 4/8-5/8 are equilibrium areas.

Buy when price reaches 0/8-2/8 levels in oversold territory, expecting reversal to higher levels.

Buy when price reaches 0/8-2/8 levels in oversold territory, expecting reversal to higher levels.

Buy when price reaches 0/8-2/8 levels in oversold territory, expecting reversal to higher levels.

Buy when price reaches 0/8-2/8 levels in oversold territory, expecting reversal to higher levels.

Sell when price hits 8/8-6/8 levels in overbought territory, targeting lower pivot levels.

Sell when price hits 8/8-6/8 levels in overbought territory, targeting lower pivot levels.

Sell when price hits 8/8-6/8 levels in overbought territory, targeting lower pivot levels.

Sell when price hits 8/8-6/8 levels in overbought territory, targeting lower pivot levels.

Based on mathematical divisions of price range, they provide consistent turning points across different timeframes.

Based on mathematical divisions of price range, they provide consistent turning points across different timeframes.

Based on mathematical divisions of price range, they provide consistent turning points across different timeframes.

Based on mathematical divisions of price range, they provide consistent turning points across different timeframes.

Published:

Nov 21, 2025 01:04 AM

Category:

We use cookies to personalize your experience. By continuing to visit this website you agree to our use of cookies

GDPR and cookie policy