Navigate Market Geometry with the Murrey MTF Indicator for MT4
In the complex landscape of Forex trading, finding a consistent mathematical framework for Support And Resistance is a game-changer. The Murrey MTF (Multi-Timeframe) indicator is a premier technical tool based on the Murrey Math Trading System. Rooted in the principles of W.D. Gann, this indicator divides Price Action into harmonic octaves, providing traders with a clear, rule-based roadmap for identifying reversals, trend continuations, and price exhaustion points across multiple timeframes.
The Logic of Murrey Math Octaves
Murrey Math operates on the theory that all markets behave similarly based on a specific set of geometric ratios. The indicator divides a price range into 1/8 increments, where each "octave" represents a specific market sentiment:
- 4/8 (The Major Support/Resistance): This is the central pivot. It is the most significant level on the chart; price will often gravitate toward this line or face heavy resistance here.
- 1/8 and 7/8 (Weak Stall and Reverse): These levels act as early warning zones where a trend might begin to lose steam.
- 0/8 and 8/8 (Ultimate Support and Resistance): These are the hardest levels to break. Price hitting these lines is often considered extremely overbought or oversold.
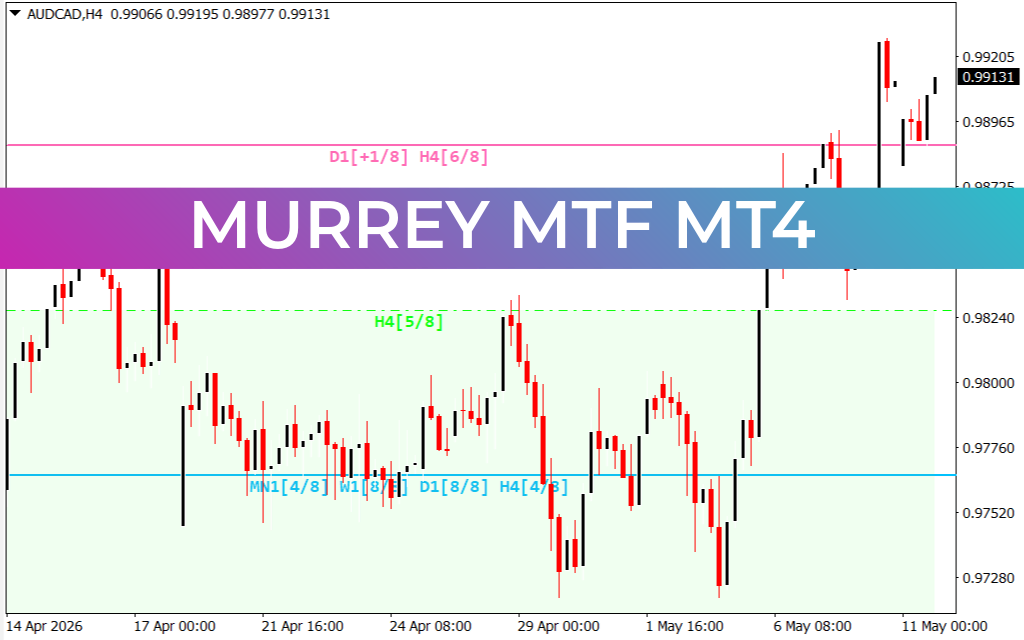
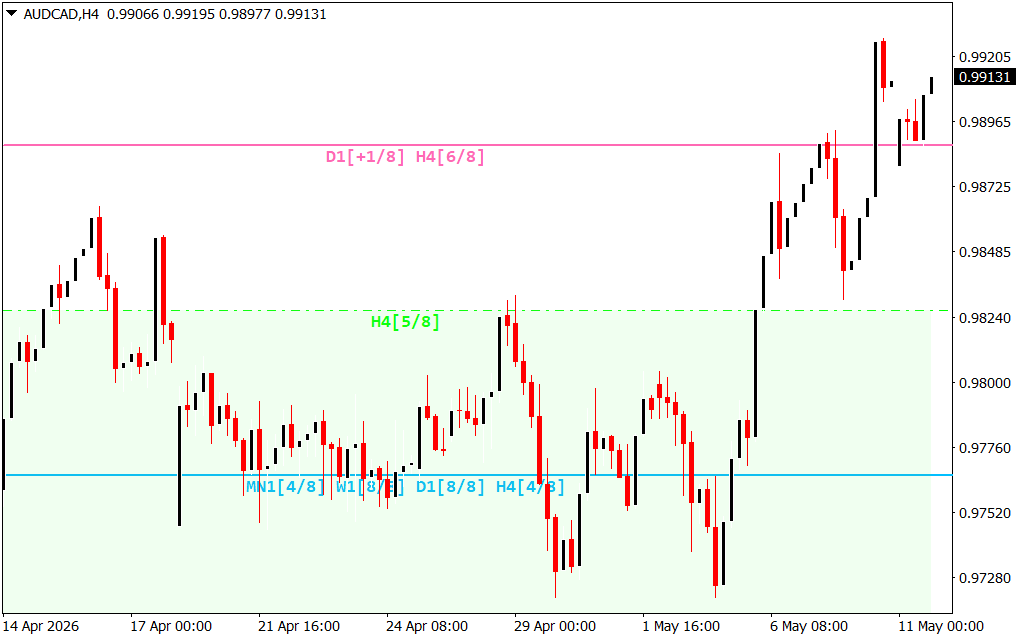
- +1/8 and -1/8 (Extreme Overshoot): As seen in the AUD/CAD H4 chart, when price breaks past the 8/8 level into the +1/8 zone (indicated by the pink line), it suggests a highly overextended market likely to undergo a sharp correction.
Multi-Timeframe (MTF) Strategic Advantage
What sets the Murrey MTF apart from standard versions is its ability to display levels from higher timeframes (like Daily or Weekly) onto your current trading chart. In the provided AUD/CAD example, you can see the D1 [+1/8] level plotted alongside H4 [6/8] and [5/8] levels.
This multi-layered approach allows for "Confluence Trading." When an H4 resistance level aligns perfectly with a Daily Murrey level, the probability of a successful trade increases exponentially. It eliminates the need to constantly flip between tabs, allowing you to see the "big picture" structural barriers while managing entries on a lower timeframe.
Key Features for Professional Traders
- Automated Calculations: Manually calculating Murrey squares is notoriously difficult. This indicator automates the entire process, updating the squares in real-time as new price data arrives.
- Visual Clarity: With color-coded lines and clear labels (e.g., H4 [5/8] in green), the indicator simplifies complex market geometry into an easy-to-read dashboard.
- Adaptive Ranges: The indicator automatically shifts its "base" range to accommodate market volatility, ensuring that your support and resistance levels remain relevant even during high-impact news events.
Why Use Murrey MTF?
The Murrey MTF indicator is perfect for traders who want to move away from subjective "gut-feeling" support lines. It provides an objective, mathematical basis for every trade. Whether you are a mean-reversion trader looking for reversals at the 0/8 or 8/8 levels, or a trend follower looking for pullbacks to the 4/8 line, this tool provides the structural discipline required for long-term profitability.
4 Downloads
Last Update:
May 11, 2026 21:26 PM
Published:
Jan 24, 2026 13:35 PM
Category: