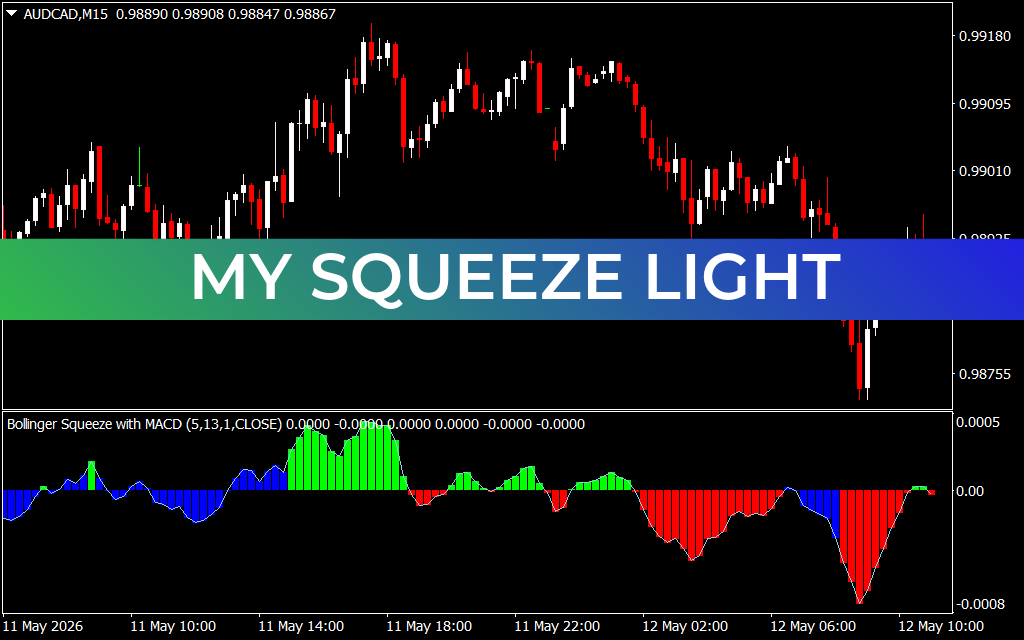
Capitalizing on Volatility with the My Squeeze Light Indicator
Market volatility is a double-edged sword, but for those with the right tools, it represents the most profitable phases of trading. The My Squeeze Light indicator is a high-performance momentum utility designed to identify "squeezes"—periods of low volatility and consolidation—and the subsequent "explosions" that occur when price breaks out. By combining Bollinger Band width analysis with MACD momentum, this indicator provides a comprehensive view of the market's energetic state.
The Anatomy of the Squeeze
The "Squeeze" occurs when market volatility drops to extreme lows, causing Bollinger Bands to contract. This state is mathematically unstable; like a coiled spring, the longer the market remains in a squeeze, the more powerful the eventual breakout is likely to be. The My Squeeze Light indicator visualizes this transition in a dedicated sub-window using a color-coded histogram:
- Blue/Dark Bars (The Build-Up): These bars appear when volatility is low and the market is entering a squeeze phase. It serves as a "get ready" signal for traders, indicating that a significant move is imminent.
- Green Bars (Bullish Expansion): When the squeeze "fires" to the upside, the histogram turns green and expands above the zero line. As seen in the AUD/CAD M15 chart, this signals strong bullish momentum and a high-probability buy opportunity.
- Red Bars (Bearish Expansion): When momentum shifts to the downside, the histogram turns red and expands below the zero line. This identifies aggressive selling pressure, allowing traders to capitalize on bearish impulses.
Strategic Advantages for Intraday Traders
The My Squeeze Light indicator is an essential tool for day traders and scalpers who need to avoid "fake-outs" and choppy Price Action:
- Momentum Confirmation: By waiting for the histogram to shift from the squeeze (blue) to expansion (green/red), you ensure that you are only entering trades when there is genuine volume behind the move.
- Trend Strength Visualization: The height of the bars indicates the relative strength of the momentum. Increasing bar height suggests a strengthening trend, while decreasing height warns of a potential plateau or reversal.
- Zero-Line Crossovers: The zero line acts as a pivot. Seeing the histogram cross and hold above or below this level provides a clear, objective bias for your trading session.
- Clear Visual Layout: The "Light" version of this indicator is optimized for performance, keeping your MT4 or MT5 terminal running smoothly while providing professional-grade data visualization.
How to Trade the Squeeze
The most successful way to implement My Squeeze Light is to trade the "Fire." When the histogram bars begin to grow larger and shift color after a period of consolidation, it marks the start of a new impulse wave. In the provided AUD/CAD example, the indicator successfully tracks the bearish expansion, providing a clear visual guide to the trend's maturity.
Pairing My Squeeze Light with price action—such as breaks of support or resistance—creates a robust trading system that filters out noise and focuses on high-velocity movements. It is the ultimate utility for traders who want to stop chasing the market and start anticipating its most explosive moves.
2 Downloads
Last Update:
May 12, 2026 14:12 PM
Published:
Jan 23, 2026 18:17 PM
Category: