Decoding Institutional Order Flow: Scalping with the NeuroTrend Indicator V1
Trading lower timeframes like the 1-minute (M1) chart requires extreme mechanical precision. On high-frequency charts, liquid currency pairs like the EUR/USD generate continuous noise, brief liquidity traps, and sharp counter-trend expansions. For active day traders and scalpers, the primary obstacle is filtering minor retail pullbacks from genuine, institutional momentum shifts. Attempting to manually track every candlestick structure rapidly leads to execution lag and costly psychological errors.
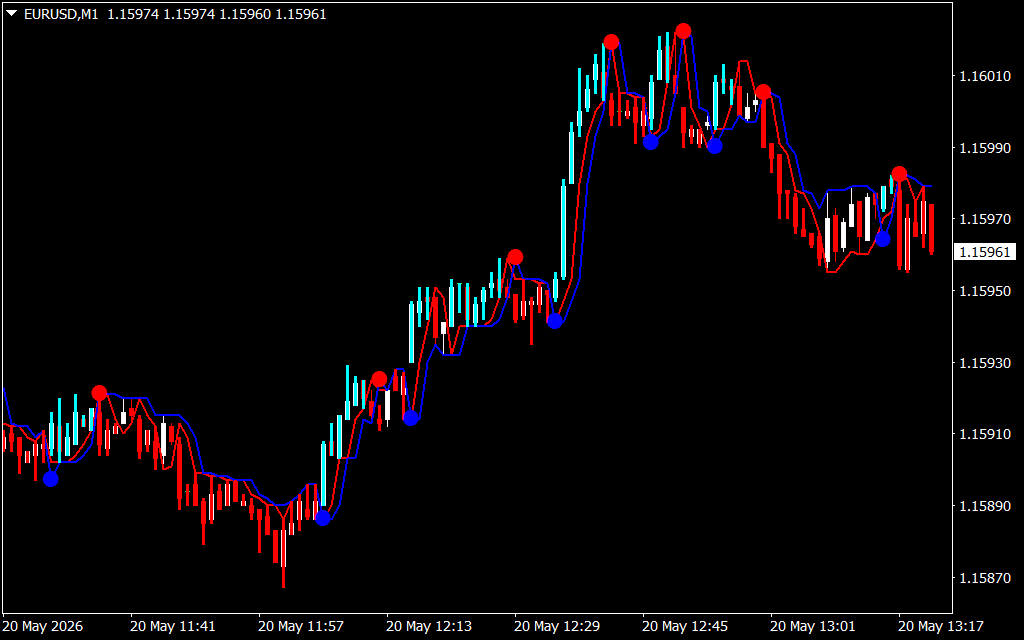
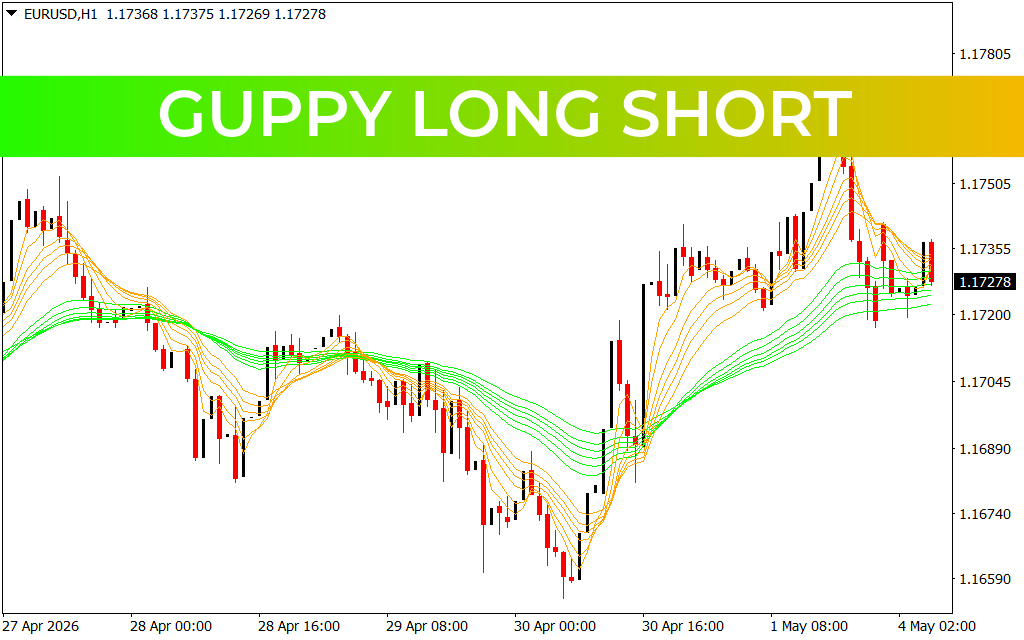
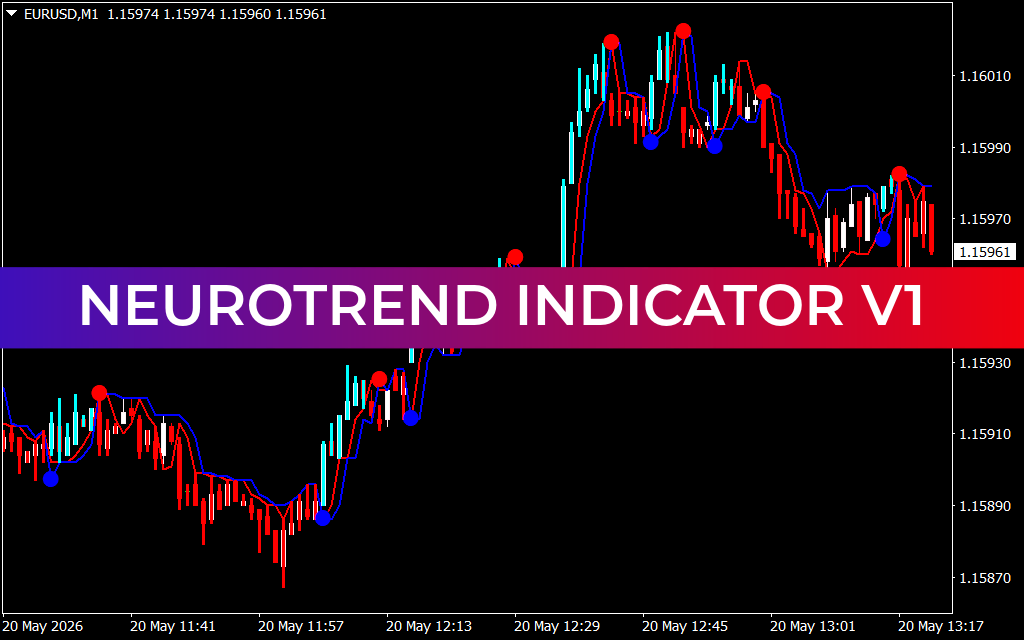
Looking closely at the EUR/USD M1 price delivery across this session, the asset establishes a defined intraday cycle. The market initially drops into a choppy, descending consolidation phase, sweeping lower liquidity bounds to carve out a firm structural floor near 1.15870. Immediately following this distribution climax, an aggressive wave of buying volume floods the market. This triggers a near-vertical markup phase that drives the exchange rate up through local resistance zones to peak near 1.16010 before shifting back into a distribution range.
To capitalize on these explosive momentum waves while keeping your risk tightly managed, professional traders deploy algorithmic smoothing systems. This is where the advanced technical architecture of the NeuroTrend Indicator V1 delivers a clear trading edge.
Machine-Learning Style Smoothness with Real-Time Reversal Alerts
Unlike traditional lagging tools such as basic moving averages, which force traders into late entries at the absolute tail-end of a trend expansion, the NeuroTrend V1 script uses a sophisticated filtering matrix. It isolates the underlying directional vector of the market while entirely eliminating standard curve lag.
When overlaid directly onto the fast-moving M1 candles, the software transforms chaotic price delivery into a highly systematic visual map:
- Dynamic Structural Channel: The indicator projects a smoothed, responsive price envelope across the chart. This channel expands during high-velocity momentum phases and contracts during non-directional consolidation. It acts as a live trailing baseline for your trade positions.
- Bullish Momentum Triggers (Blue Signal Dots): Notice the exact moment the market bottoms out near 1.15870. As institutional volume surges at 11:57, the indicator prints distinct blue dots along the lower channel band. This signals that buyers have aggressively seized control, offering scalpers a mechanical trigger to capture the massive upward expansion.
- Bearish Exhaustion Triggers (Red Signal Dots): Conversely, as the vertical trend drives price into overextended territory near 1.16010, the script prints clear red dots at the upper channel boundary. This flags immediate trend depletion, marking an ideal zone to take profits or look for short counter-trend scalps.
Optimizing Technical Execution and Equity Protection
Achieving long-term profitability requires eliminating subjective bias from your chart analysis. Incorporating an automated trend corridor directly into your platform standardizes your entry, exit, and trailing stop parameters. The NeuroTrend Indicator V1 is fully optimized to run efficiently in the background without causing chart lag.
The custom settings panel allows you to fine-tune lookback sensitivities, adjust risk coefficients to fit your strategy, and set up real-time push notifications the exact moment a buy or sell dot prints. Integrating this institutional-grade filtering system into your MetaTrader infrastructure provides the structural clarity needed to sidestep retail traps and scale your portfolio with clinical precision.ls at IndicatorForest.com
12 Downloads
Last Update:
May 20, 2026 16:22 PM
Published:
Jan 18, 2026 17:29 PM
Category: