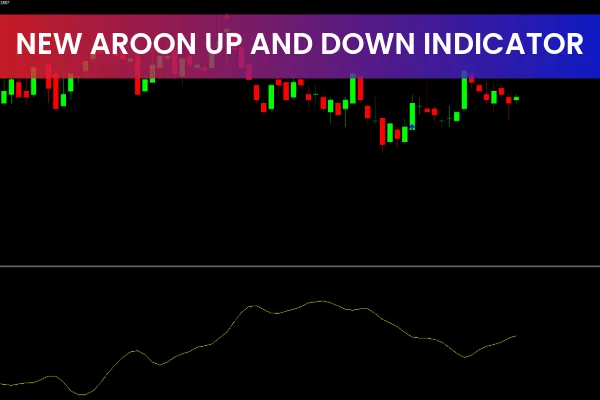
The New Aroon Up and Down Indicator is a powerful and versatile tool designed to measure trend strength, trend direction, and potential reversal points in the market. It calculates how long it has been since price made its highest high and lowest low within a chosen period, offering a clear understanding of market momentum.
With its visual buy/sell arrows and oscillator graph, the indicator provides intuitive signals suitable for both beginners and professional traders. It is compatible with MT4 and MT5, making it a flexible addition to any trading strategy.
How the New Aroon Up and Down Indicator Works
The indicator consists of two major components:
Aroon Up
Measures how recently price made a new high → Indicates bullish momentum.
Aroon Down
Measures how recently price made a new low → Indicates bearish momentum.
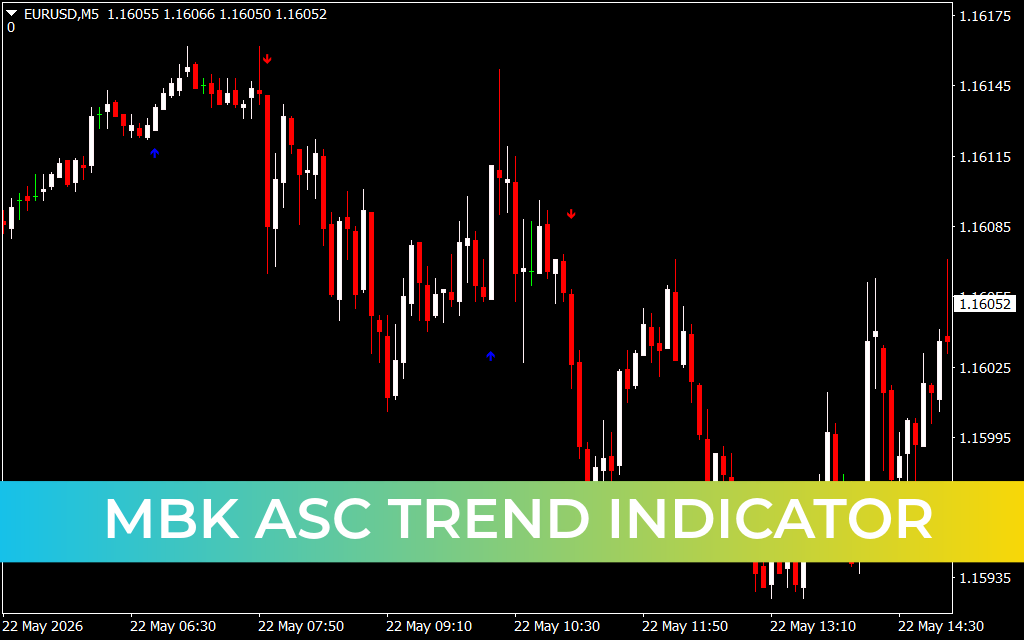
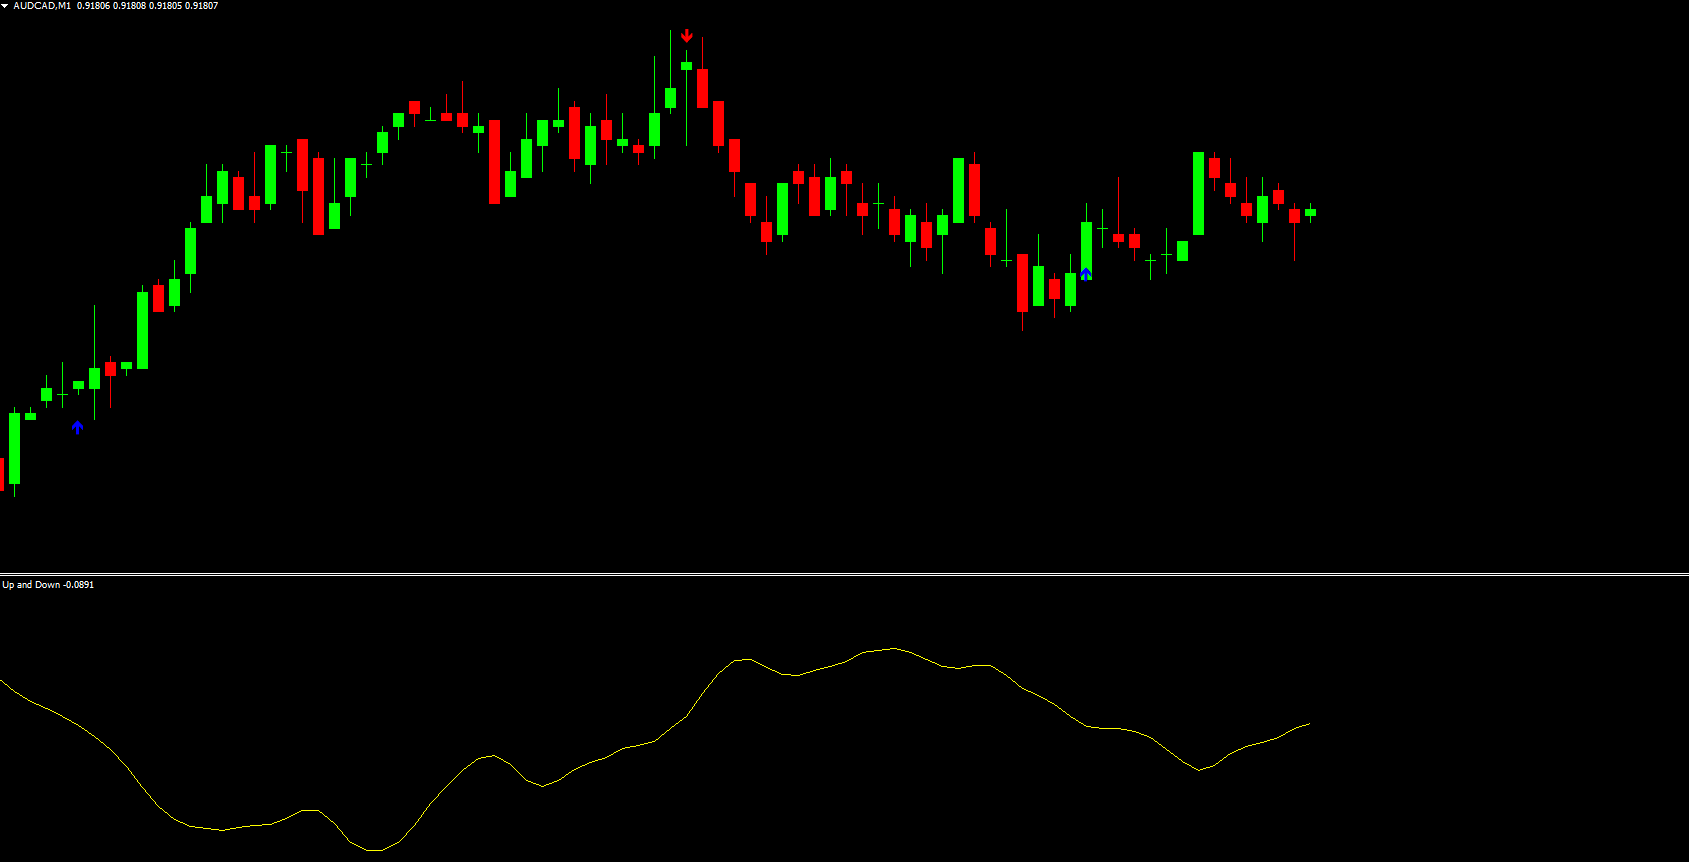
Visual Arrows
Blue Arrow = Buy Signal
Appears when Aroon Up crosses above Aroon Down, signaling rising bullish momentum.
Red Arrow = Sell Signal
Appears when Aroon Down crosses above Aroon Up, signaling increasing bearish momentum.
Oscillator Graph
Displayed at the bottom of the chart, showing:
High values → Strong trend
Low values → Weak trend / Consolidation
This combination helps traders filter out false signals and focus only on strong market conditions.
New Aroon Up and Down Trading Signals
You can use the indicator for:
Trend Identification
When Aroon Up stays above Aroon Down, the market is likely in a bullish phase.
When Aroon Down stays above Aroon Up, the market is likely in a bearish phase.
Reversal Signals
Crossovers of the two lines indicate potential trend reversals, supported by color-coded arrows on the chart.
Entry and Exit Timing
Enter early during a new trend
Exit when trend weakness appears in the oscillator
Avoid trading during consolidation phases
Scalping, Intraday, and Swing Trading
Because of its responsiveness, the indicator works equally well on:
M1–M15 for Scalping
M30–H4 for intraday
Daily charts for swing trading
Conclusion
The New Aroon Up and Down Indicator is an excellent tool for identifying Trend Strength, trend reversals, and precise entry or exit points. With its clear visuals, customizable settings, and reliable momentum readings, it fits seamlessly into any trading strategy—whether you're scalping, day trading, or swing trading.
Download it today and enhance your trading decisions with accurate, momentum-based signals.
FAQ
1 Download
Published:
Dec 08, 2025 01:44 AM
Category: